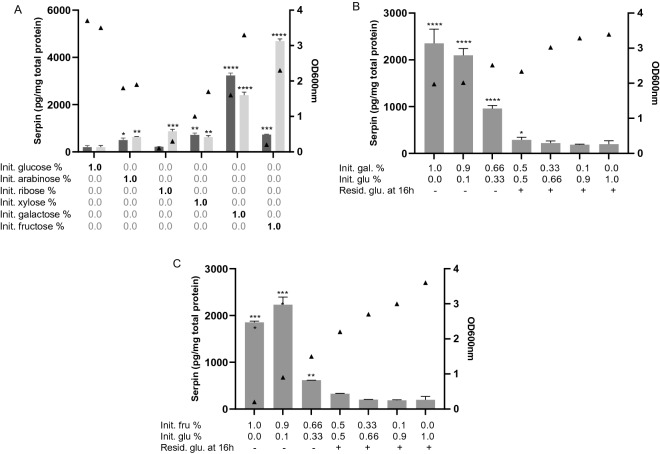
Figure 3.
Serpin concentration measured in extracts of B. longum NCC 2705 grown for 24 (dark grey) and 48 h (light grey) on different monosaccharides (A). Serpin concentration measured in B. longum NCC 2705 grown for 16 h on different concentrations of glucose and galactose (B) and glucose and fructose (C). Bars represent serpin quantity normalized by total protein content, means and standard deviations are depicted. Initial carbohydrate concentrations are depicted. Presence of residual glucose in the culture supernatant after 16 h of incubation is indicated (+ /−) (B,C). Triangles represent growth at the end of the incubation, measured by optical density at 600 nm. P-values represent statistical difference to the glucose control group. ****p < 0.0001; ***p < 0.001; **p < 0.01; *p < 0.05.

