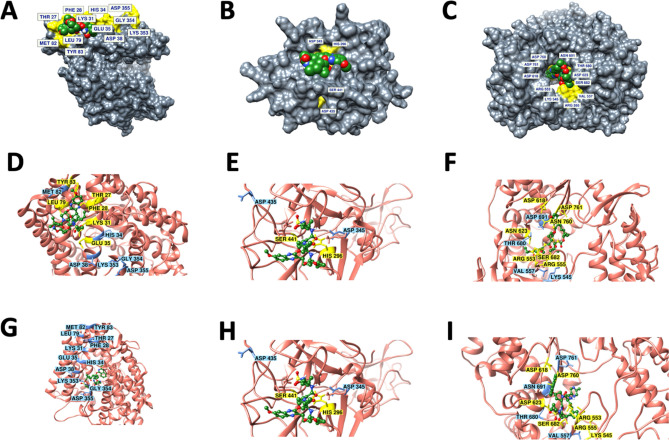
Figure 1.
Surface plot and 2D interaction map of protein–ligand interactions of (A, D) ACE2-Grazoprevir (B, E) TMPRSS2-Grazoprevir and (C, F) RdRP-Grazoprevir complexes. (G) ACE2-Paritaprevir (H) TMPRSS2-Paritaprevir (I) RdRP-Paritaprevir complexes showing best fit conformation having the highest binding energy selected for each protein, for our further studies, out of all the conformations generated. Grazoprevir is shown in space filled representation in the the top pannel. Key residues that are reported to be critical either for SARS-CoV-2-host interactions and/or the catalytic activity of these proteins are displayed in yellow and the ones not interacting yet important are displayed in blue. Proteins and ligands are shown in cartoon and ball & stick representations respectively in middle and lower pannel.

