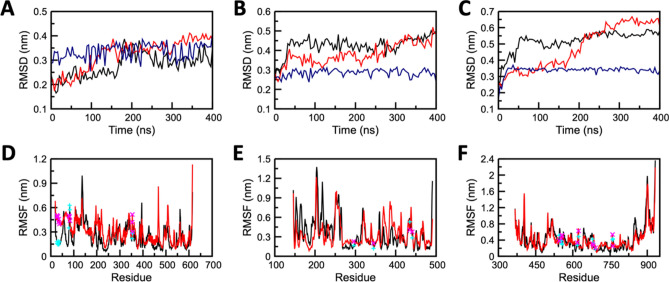
Figure 2.
Conformational stability of apo and complex forms of (A, D) ACE2 (B, E) TMPRSS2, and (C, F) RdRP protein. (A, B, C) Backbone-RMSD for protein and all-atom RMSD for Grazoprevir and (C, D, E) Residual RMSF. Profile of apo, complex structures, and Grazoprevir are displayed in red, black, and blue curves , respectively. Locations of key residues are shown by cyan and magenta color symbols for complex and apo states respectively.

