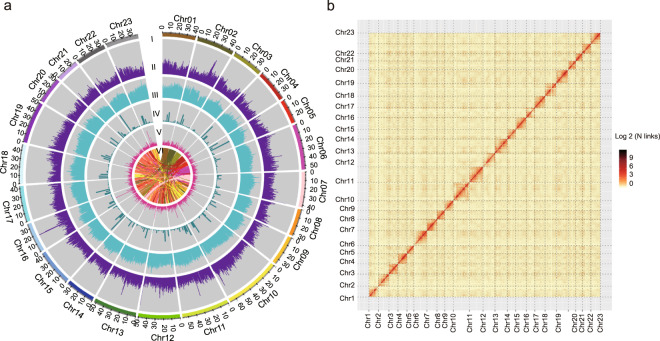
Fig. 3. Chromosomal features and genome-wide all-by-all Hi-C interaction heatmap.
a Chromosomal features. I, The 23 assembled chromosomes of the genome. II, Distribution of the GC content in the genome (purple). III, Repetitive sequences in the olive genome (cyan). IV, Distribution of gene density (bottle green). V, SSR (rose red). VI, Major interchromosomal relationships in the olive genome. All of these data are shown in 1 Mb with sliding windows of 500 kb. b Intensity signal heatmap of the Hi-C chromosome

