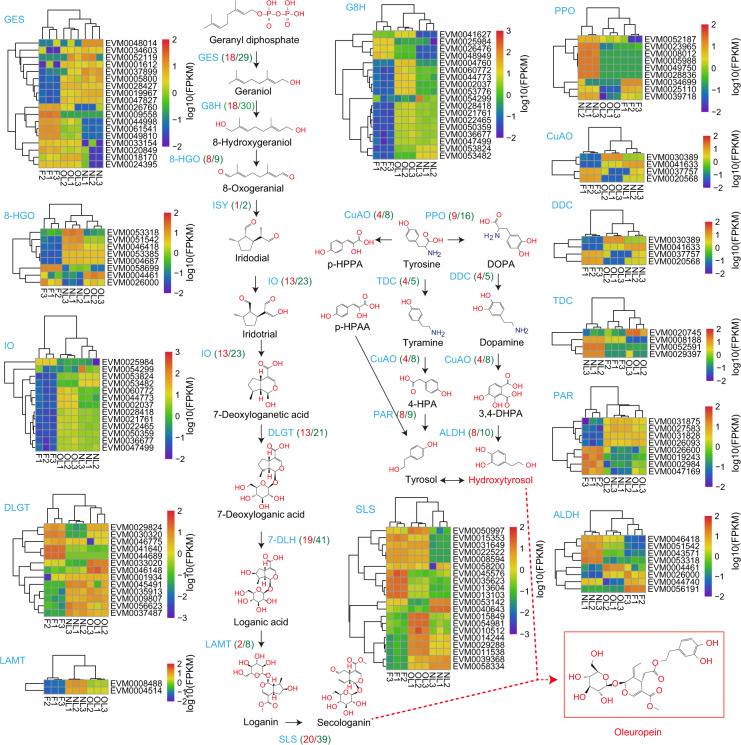
Fig. 7. Identification and expression level of oleuropein and hydroxytyrosol biosynthesis genes in olive.
Blue is the abbreviation for the gene, red numbers in brackets represent the number of detected genes in the gene family, and the green number in brackets is the number of total transcripts in the family. Heatmaps show the expression level of differentially expressed genes: yellow to red color represents higher than log10 (FPKM) data of genes; green to blue color represents lower than log10 (FPKM) data of genes. Samples are fruits (F1-F3 indicate the three biological replications), fully expanded leaves from shoots (NL1-NL3 indicate the three biological replications), and old leaves from the base of the stem (OL1-OL3 indicate the three biological replications). GES geraniol synthase, G8H geraniol 8-hydroxylase, 8-HGO 8-hydroxygeraniol oxidoreductase, ISY iridoid synthase, IO iridoid oxidase, 7-DLGT 7-deoxyloganetic acid-O-glucosyl transferase, 7-DLH 7-deoxyloganic acid hydroxylase, LAMT loganic acid methyltransferase, SLS secologanin synthase, PPO polyphenol oxidase, DDC DOPA decarboxylase, CuAO primary amine (copper-containing) oxidase, ALDH alcohol dehydrogenase, TDC tyrosine decarboxylase, PAR phenylacetaldehyde reductase, p-HPAA p-hydroxyphenylpyruvic acid, p-HPAA p-hydroxyphenylacetic acid, DOPA dihydroxyphenylalanine, 3,4-DHPA 3,4-dihydroxyphthalic acid, 4-HPA 4-hydroxyphenylacetic acid

