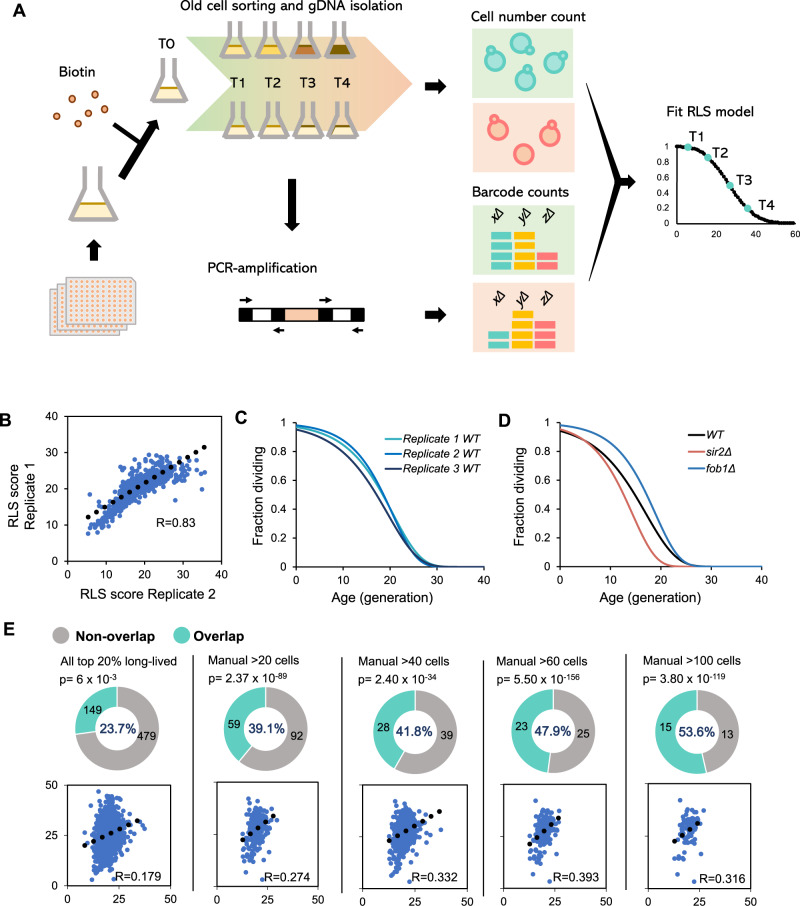
Fig. 1. Pipeline and quality control for SEBYL method.
A Pipeline of SEBYL screening method. B Correlation analysis of final RLS score from screening replicate 1 and replicate 2. C Survival curves of wild-type BY4742 strains from three replicates. D Survival curves of wild-type, sir2Δ and fob1Δ strains. E Overlap between long-lived yeast deletion strains identified from SEBYL and manual microdissection screening. Manual results were grouped by number of cells included in experiments. Bottom figures indicate correlations between manual and SEBYL results. X-axis indicates SEBYL RLS score, Y-axis indicates RLS measured by manual screen. p-value calculated by χ2 test. See also Fig. S1.

