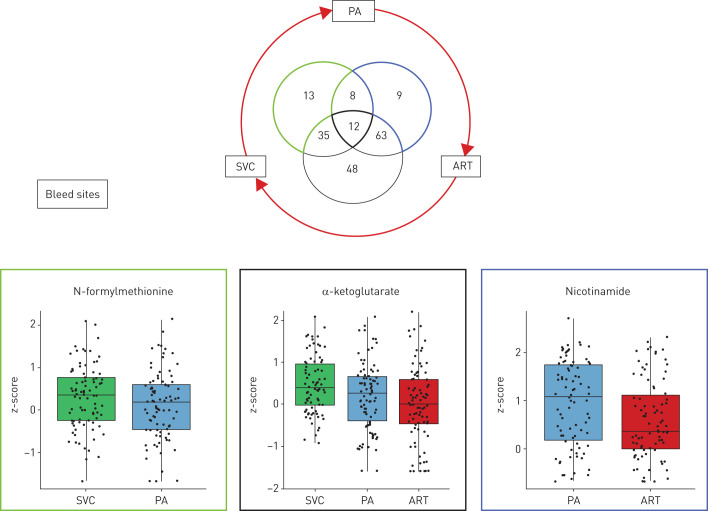
FIGURE 5.
Overlap in metabolites showing significant pulmonary artery (PA)–radial artery (ART), superior vena cava (SVC)–PA and ART–SVC gradients. Boxplots show data for example metabolites from the SVC–PA- (green outline) and PA–ART- (blue outline) specific results and α-ketoglutarate, which was significant across all three gradients.

