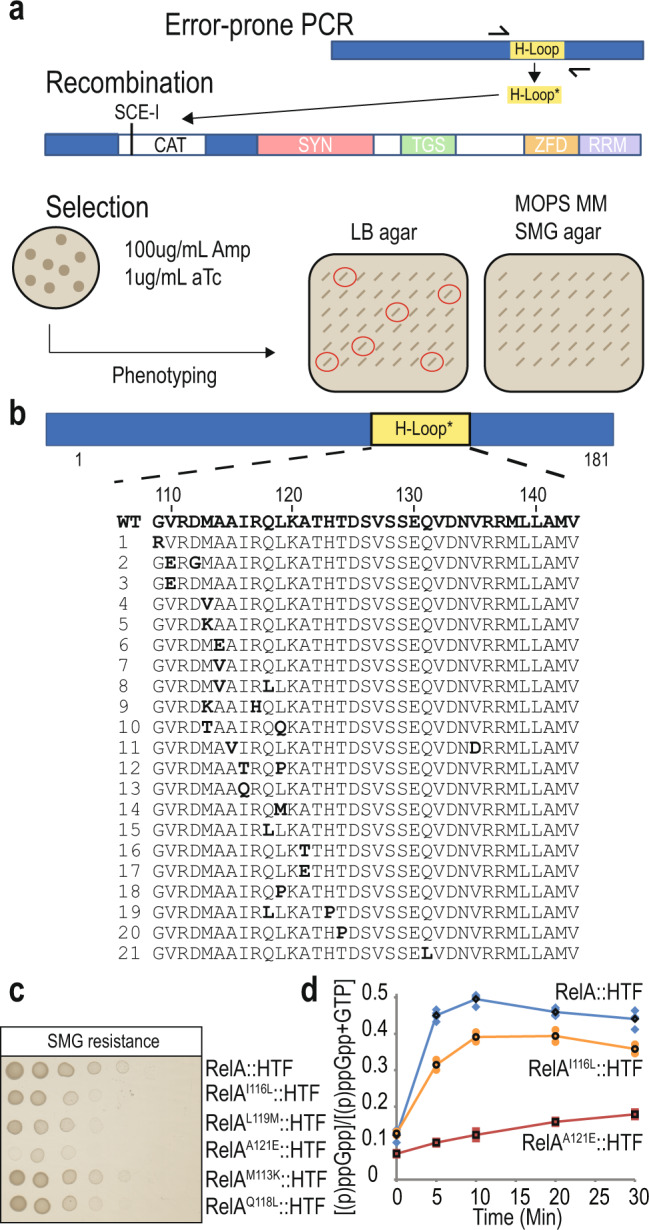
Fig. 2. Isolation of H-loop mutants with altered (p)ppGpp synthesis.

a Outline of the H-loop random mutagenesis screen. The H-loop was amplified using error-prone PCR as described in methods. The PCR product was then electroporated into MG1655 relAI116::cm::HTF containing plasmid pWRG99, which have previously been induced with 0.2% arabinose to express lambda recombinase36. After phenotypic expression at 37 °C, cells were plated on LB agar containing 100 μg/mL ampicillin (Amp) and 1 μg/mL anhydrotetracycline (aTc). Induction of the Sce-I restriction enzyme by aTc addition facilitated the site-directed replacement of the chloramphenicol resistance gene cassette (CAT) with the PCR product. Colonies were selected and re-streaked onto LB agar (loading control) and MOPS MM SMG plates to assay RelA functionality at 30 °C. Colonies that showed decreased growth on functional plates were sequenced (indicated with red circles). b Overview of the H-loop and substitution mutants isolated in a). Repeated mutations, nonsense and frame-shift mutations were excluded in this study. c Assaying the stringent response in selected substitution mutants. Substitution mutations I116L, L119M, A121E, M113K and Q118L were introduced by site-directed recombination in MG1655 relA::HTF as described in methods. The cells were grown in LB 37 °C, washed in PBS and spotted onto MOPS MM SMG plates (SMG resistance) followed by incubation at 30 °C (See Supplementary Fig. 2a for loading controls). d (p)ppGpp measurements in selected mutants in response to isoleucine starvation. MG1655 relA::HTF (blue diamonds), relAI116L::HTF (Orange circles) and relAA121E::HTF (red squares) were grown exponentially in MOPS minimal medium containing 32P-labeled phosphate. To induce isoleucine starvation, L-Valine was added, to a final concentration of 500 μg/mL. Samples were collected before (time zero) and after starvation, followed by precipitation and separation by thin layer chromatography. The mutant curves with black symbols are based on averaged quantifications from n = 2 biological independent samples see Supplementary Fig. 1i–l.
