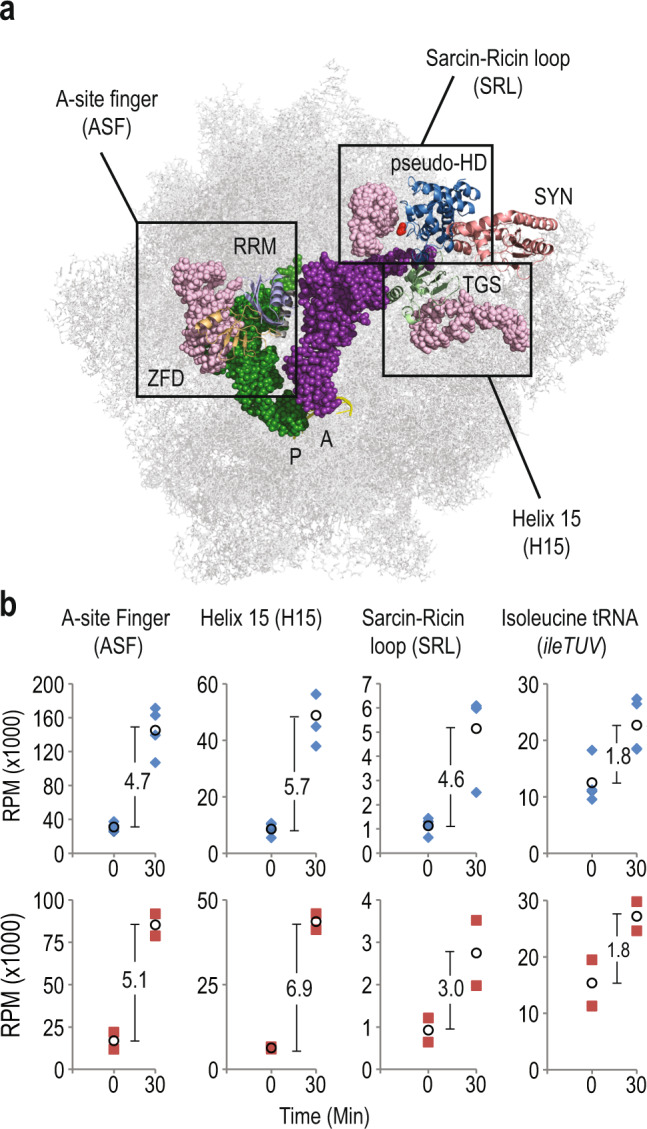
Fig. 3. RelAA121E displays decreased interaction with the ribosome in response to isoleucine starvation.

a Structure of RelA bound to tRNA and the ribosome (PDB: 5IQR). Functional domains have been coloured as in Fig. 1a and A- and P-site tRNAs are indicated in magenta and green respectively. Previously identified RelA ribosome interaction sites using false discovery rate (FDR) analysis2: A-site Finger (ASF, nt 834–927 in 23 S rRNA), Sarcin-Ricin Loop (SRL, nt 2652–2673 in 23 S rRNA) of 50 S ribosomal subunit and Helix 15 (H15, nt 328–407 in 16 S rRNA) of 30 S ribosomal subunit are indicated with boxes in light pink. Location of A121 in the hydrolase domain is indicated in red. b Plots of normalized cDNA coverage (Reads per Million, RPM) with ribosome and tRNAileTUV binding sites obtained from CRAC analysis. MG1655 relA::HTF (blue diamonds) and MG1655 relAA121E::HTF (red squares) were analysed before (0) and 30 min after isoleucine starvation (30). Average coverage between biological independent replicates (n = 4 for MG1655 relA::HTF and n = 2 for MG1655 relAA121E::HTF) are indicated with black circles and fold change between conditions are indicated between the data points (For replicate plots and data points see Supplementary Fig. 3b–d and h).
