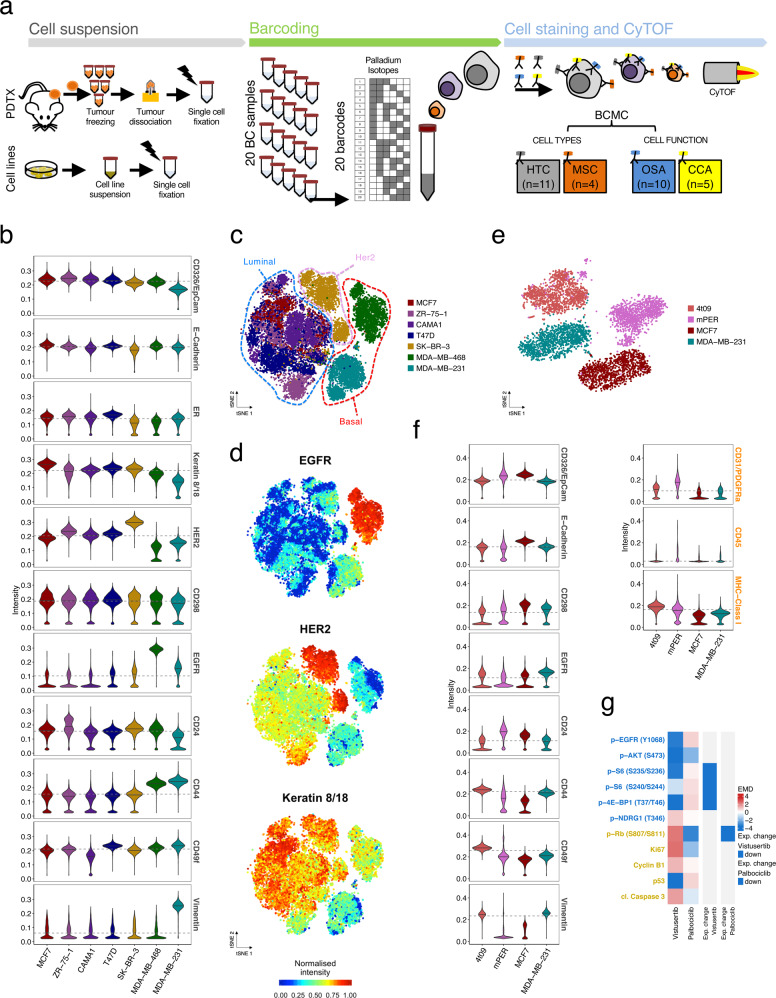
Fig. 1. Development of a mass cytometry antibody panel for breast cancer.
a Experimental workflow. Cell suspensions: Single-cell suspensions from PDTX samples or cell lines were derived as described in “Methods” and fixed in 4% PFA (in black) in batches of up to 20 samples; barcoding: individual samples were barcoded with the combination of the 6 palladium isotopes to enable multiplexing of up to 20 samples; cell staining and cytometry with time-of-flight (CyTOF): cell suspensions were stained with the breast cancer mass cytometry (BCMC) panel and then run through the Helios CyTOF platform. Protein markers were organised in 4 subpanels: HTC (human tumour compartment), MSC (mouse stroma compartment), OSA (oncogenic signalling activation) and CCA (cell cycle and apoptosis). b MC-based intensity distribution of HTC markers in a collection of 7 breast cancer cell lines (Ncells = 20,846). Horizontal lines (grey) represent overall median values across the samples. c tSNE plots of 7 breast cancer cell lines (as per panel b). Each spot represents a cell, coloured as per cell line of origin. All BCMC markers were included in the analysis. d tSNE plots as in c. Cells are coloured by the intensity of selected HTC markers, namely EGFR, HER2 and Keratin 8/18. All marker intensities are reported in Supplementary Fig. 1b. e tSNE plot of cells from 4 distinct samples: (i) 4T09, a mouse mammary tumour cell line, (ii) mPER, murine peritoneal tissue from NSG mice, (iii) the human breast cancer cell lines MCF7 and (iv) MDA-MB-231 (Ncells = 26,154). All BCMC markers were included in the analysis. f MC-based intensity distribution of selected HTC and MSC markers for cell lines in e. Horizontal lines (grey) represent overall median values across the samples. g Heatmap showing Earth Mover’s Distance (EMD) of OSA and CCA markers in MCF7 cells treated for 1 h with either vistusertib (1μM) or palbociclib (1μM) compared to the same cells in DMSO as a control (Ncells = 36,582). Expected changes in a subset of markers are indicated for each compound.

