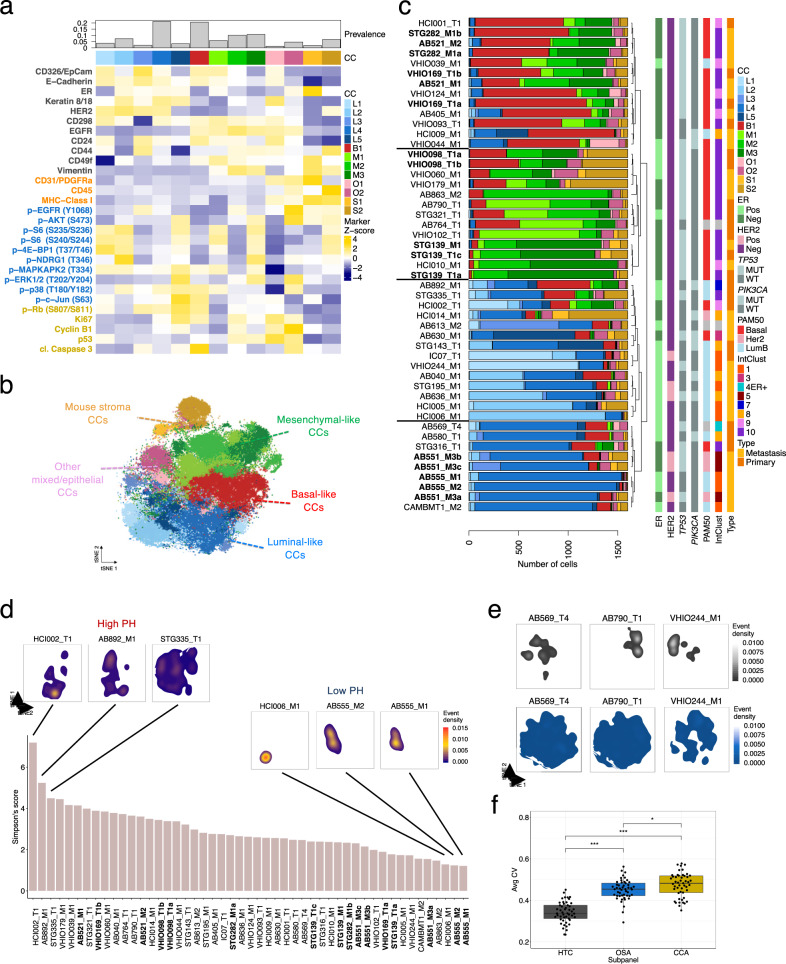
Fig. 3. Identification and distribution of major cell phenotypes in breast cancer PDTXs.
a Median expression intensity of all proteins tested by BCMC panel across 13 PhenoGraph-defined cell-clusters (CCs). Top barplot represents the prevalence of each CC across all PDTXs. The marker subpanel is colour coded as in Fig. 1a. b tSNE plot of cells from 49 PDTXs coloured based on PhenoGraph-defined CCs (Ncells = 78,400, Nmarkers = 29). Highlighted are the following cellular phenotypes or CCs: mouse stroma (orange), mesenchymal (green), luminal (blue), basal (red) and other mixed/epithelia (pink). c Barplots summarising the prevalence of each of the 13 CCs in all PDTX models ordered based on hierarchical clustering. Histological and molecular features are indicated in vertical bars to the right. PDTXs used as experimental set reference samples or originating from the same patient are represented in bold. d Simpson’s score based on 11 human CC proportions across all PDTXs. tSNE density plots of cell distribution for selected models with high and low phenotypic heterogeneity (PH) are shown. tSNE density plots for all the other models are shown in Supplementary Fig. 4d. e tSNE density plots of cell distribution for 3 PDTX models; dimensionality reduction was carried out including either HTC (upper panel; in grey) or OSA (lower panel, in blue) protein markers. See Supplementary Fig. 3e, f for the complete set of models. f Box plots of the average coefficient of variation (CV) computed per model (n = 49) for HTC (human tumour compartment), OSA (oncogenic signalling activation) or CCA (cell cycle and apoptosis) subpanel markers. Pairwise comparisons using two-sided Student’s t-test (pHTC-OSA < 2.2e−16, pHTC-CCA < 2.2e−16, pOSA-CCA = 0.035). In the box plots, the lower and upper hinges correspond to the first and third quartiles. The upper and lower whisker extends from the hinge to the largest value no further than 1.5 * IQR from the hinge. Data beyond the end of the whiskers are plotted individually.

