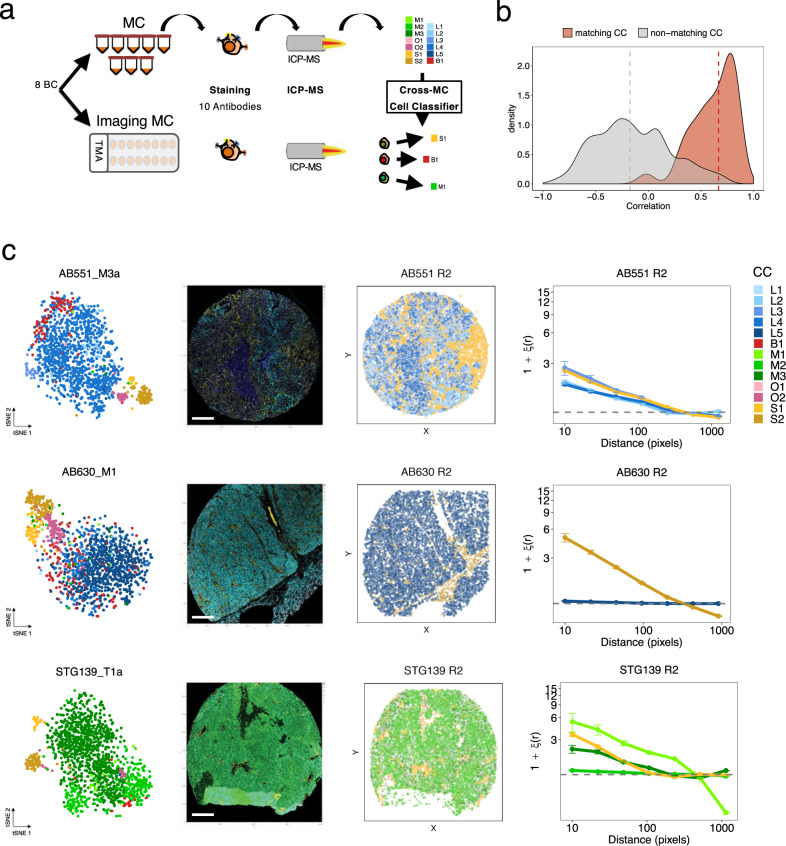
Fig. 4. Imaging mass cytometry reveals the spatial distribution of cell phenotypes in xenografts.
a Schematic representation of model-specific cross-mass cytometry cell-classifier (Nsamples = 15, Nmarkers = 10, Ncells = 99,336). From mass cytometry (MC) data, a model-specific cell-cluster (CC) classifier was trained and applied to imaging mass cytometry (IMC) from tissue microarray (TMA) segmented cells from the same model in order to classify cells into one of the CCs. b Distribution of MC-IMC centroid correlations (matching CC centroids in red; non-matching CC centroids in grey). Median values of matching and non-matching CC centroids are indicated by dashed vertical lines. c Examples of mapping of MC CCs to IMC data for AB551_M3a, AB630_M1 and STG139_T1a. From left to right: tSNE plot based on MC profiling coloured as in Fig. 3b; IMC image coloured for a subset of relevant markers representative of distinct CCs; pseudo-image with segmented cells labelled according to the classifier coloured as in Fig. 3b; two-point autocorrelation analysis results for each CC quantifying the deviation from a random cell distribution as a function of distance. Data are presented as mean values ± SD.

