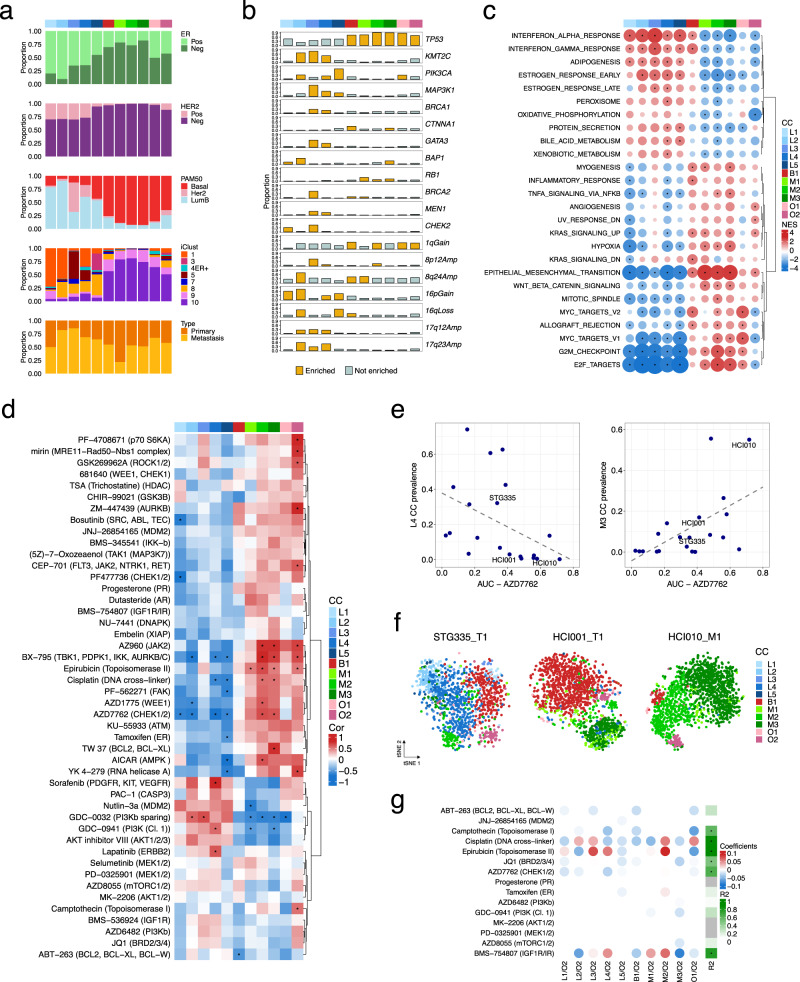
Fig. 5. Integration of PDTX cell phenotypes with molecular features and drug-response data.
a Prevalence of different breast cancer subtypes as defined by IHC ER and HER2 status, PAM50 and IntClust subtypes across the 11 human cell-clusters (CCs) indicated in colour as in Fig. 3b. b Prevalence of somatic mutations in major breast cancer mutation-driver genes and copy number aberrations (CNAs) across the 11 human CCs. Yellow bars-significant enrichment (two-sided hypergeometric test, adjusted p < 0.01). Only aberrations with a prevalence >0.25 in at least 1 CC are shown (for a full list see Supplementary Fig. 6b). c Gene set Enrichment Analysis using the ‘Hallmark’ collection. Enrichment analysis was run for each CC after ranking all genes by their correlation with the CC prevalence. Significant enrichment (FDR < 0.01) is indicated by a black dot. Normalised enrichment score and positive/negative associations are indicated by the circle size and colour, respectively. For each CC, the top 5 gene sets with the highest positive enrichment and top 5 with negative enrichment were selected. The resulting list of unique gene sets is shown. d Heatmap of Spearman’s correlation between human CC prevalence and drug-response area under the drug-response curve (AUC) in a subset of PDTXs (10 ≤ n ≤ 22). A two-sided p-value < 0.05 is indicated by an asterisk. e Scatter plots of single CC prevalence against AZD7762 AUC (association for L4: Spearman correlation ρAZD7762 = −0.64, p = 0.003, two-sided; association for M3: Spearman correlation ρAZD7762 = 0.56, p = 0.009, two-sided). f tSNE plots of cells belonging to the 11 human CCs highlighting the proportion of M3 CC in 3 models (STG335_T1, HCI001_T1, HCI010_M1) with increased sensitivity to chemotherapy/DDR drugs (e.g. AZD7762). g Heatmap summarising the coefficient values assigned to each CC log-ratio by fitting regularised linear models to predict the response (AUC) to each compound (rows). R2 of the model score vs observed AUC are annotated on the right (asterisk indicating R2 > 0.5).

