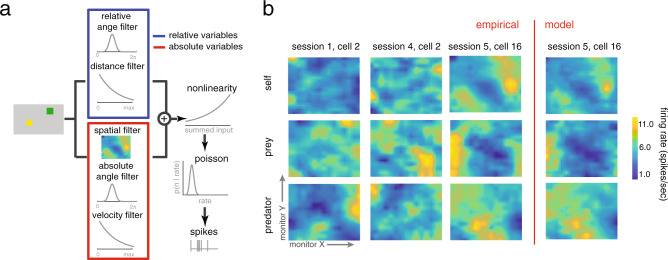
Fig. 2. Examples of multi-agent world-centric mapping functions in dACC.
a Schematic of the analysis approach we took, see “Methods” and ref. 34. b Maps of the responses of three example neurons with significant spatial selectivity, chosen to illustrate the typical types of responses we see. X- and Y-dimensions in each subplot correspond to X- and Y-dimensions of the computer monitor; the Z-dimension corresponds to the firing rate of that cell. Yellower areas indicate spots in which entry tended to result in spiking. Top row: responses to self position. Middle row: responses to prey position. Bottom row: responses to predator position. Rightmost column: responses of the model (see “Methods”) for the same neuron whose observed responses are shown in the adjacent column.

