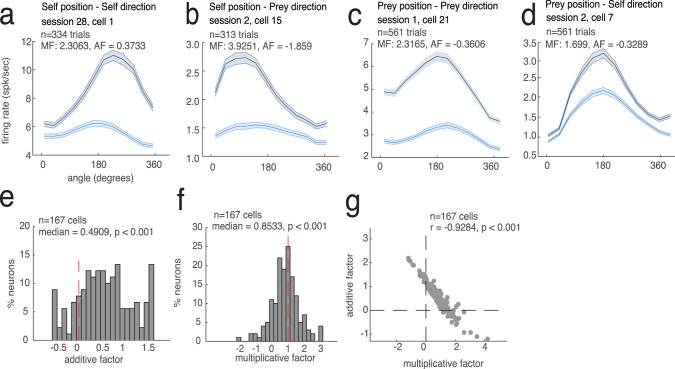
Fig. 6. Mixed selectivity.
We illustrate our findings on mixed selectivity by focusing on relative angle. See supplement for other variables. a–d Angular tuning curves for example neurons that showed significant mixed selectivity. Horizontal axes reflect angle between self and prey; 0 indicates heading toward the prey. Neurons show angular selectivity that is modulated by anticipated reward. Gray line: high-value prey. Blue line: low-value prey. a Multiplicative influence of self direction by self position, b self direction by prey position, c prey direction by self position, and d prey direction by prey position. The error bands are connection of standard deviation in each data point. Each error bars are standard deviation for 1000 times of bootstrapping the neurons. e, f Additive (e) and multiplicative (f) factors of population. AF > 0 indicates additive interaction; MF deviates from 1 indicates multiplicative interaction. g Relationship between MF and AF. Negative correlation indicates that neurons with multiplicative interaction are less likely to have additive interaction.

