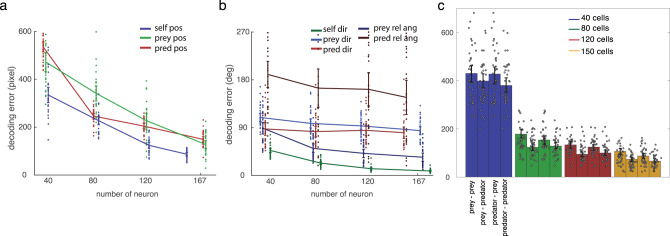
Fig. 7. Decoding performance of the model.
a Population decoding accuracy (distance between model and empirical data) for self (blue) position, prey (green), and predator (red) position improves (i.e., gets lower) as number of neurons analyzed rises. This analysis indicates that these variables are encoded in a distributed manner, and that all three agents can be readily decoded. b Population decoding accuracy for self (dark green) direction, prey (purple) direction, predator (red) direction, prey relative angle (dark blue), and predator relative angle (maroon). All curves decrease modestly, indicative of distributed decoding. c Time-to-time decoding performance when either prey is closer or predator is closer. Then, the decoding performance for either prey position or predator position was estimated. Decoding accuracy was estimated as a function of number of cells, in groups corresponding to 40, 80, 120, and 150 cells. Statistical significance and error bar widths (i.e., SD) are obtained from bootstrapping the neural population for 30 times (total N = 167 neurons).

