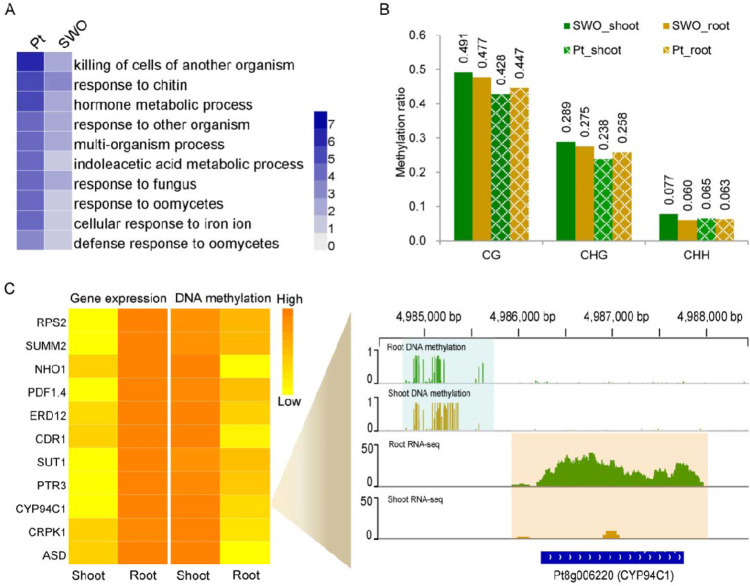
Fig. 4. Differentially expressed genes and DNA methylation variation between roots and shoots.
A Selected GO terms specifically enriched for the highly expressed genes in P. trifoliata roots. A darker blue color indicates a more significant P-value. All GO terms have a P-value < 0.05. B DNA methylation levels in the shoots and roots of P. trifoliata and sweet orange. C Heatmaps showing the expression levels and promoter methylation levels of selected resistance-related genes. The genome browser snapshot in the panel on the right shows the methylation level and expression level of CYP94C1 in each developmental stage. The differentially methylated regions and expressed transcripts are shadowed with green and yellow boxes, respectively

