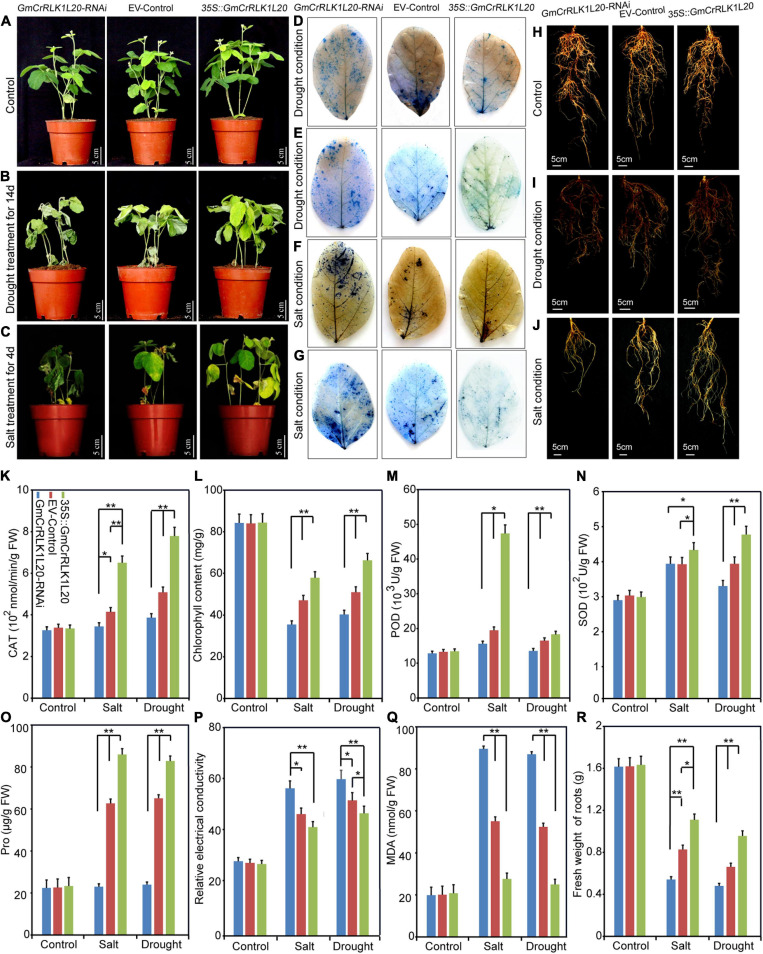
FIGURE 9.
Phenotype and function analysis of soybean GmCrRLK1L20 in transgenic soybean hairy roots under drought and salt stresses conditions. (A–C) growth conditions of GmCrRLK1L20-RNAi, EV-Control (the empty plasmid of pCAMBIA3301), and GmCrRLK1L20-OE under normal, drought, and salt stresses conditions, respectively. NBT (D,F) staining of the leaves of GmCrRLK1L20-RNAi, EV-Control, and GmCrRLK1L20-OE under drought and salt conditions, respectively. The brightness of the leaf color indicates H2O2 and O2– contents (D,F). trypan blue (E,G) staining of the leaves of GmCrRLK1L20-RNAi, EV-Control, and GmCrRLK1L20-OE under drought and salt stresses conditions, respectively. Trypan blue staining demonstrates that dead cells can be stained, but living cells cannot (E,G). (H–J) The root phenotype of GmCrRLK1L20-RNAi, EV-Control, and GmCrRLK1L20-OE under normal, drought, and salt stresses conditions, respectively. (K) Catalase (CAT) content of transgenic soybean hairy root composite plants and EV-control plants under salt and drought conditions. (L) Chlorophyll content of transgenic soybean hairy root composite plants and EV-control plants under salt and drought conditions. (M) Peroxidase (POD) content of transgenic soybean hairy root composite plants and EV-control plants under salt and drought stresses conditions. (N) Superoxide dismutase (SOD) content of transgenic soybean hairy root composite plants and EV-control plants under salt and drought conditions. (O) Proline (Pro) content of transgenic soybean hairy root composite plants and EV-control plants under salt and drought conditions. (P) Relative electrical conductivity of transgenic soybean hairy root composite plants and EV-control plants under salt and drought conditions. (Q) Malondialdehyde (MDA) content of transgenic soybean hairy root composite plants and EV-control plants under salt and drought conditions. (R) Fresh weight of roots of transgenic soybean hairy root composite plants and EV-control plants under salt and drought conditions. Vertical bars demonstrate ± SE of three biological replicates. ANOVA test indicated that there were significant differences (*p < 0.05, **p < 0.01).

