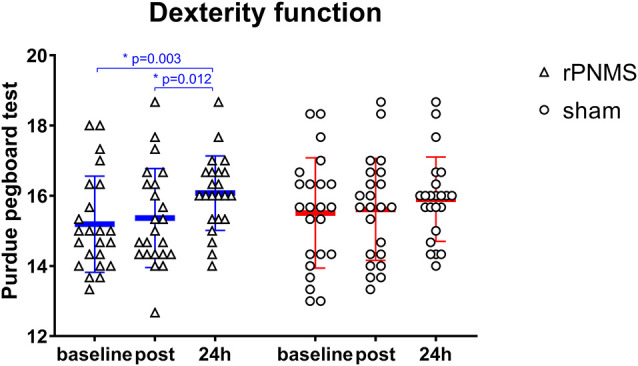
Figure 6.

The hand dexterity function in the Purdue pegboard test was assessed at baseline, immediately after the intervention, and 24 h after interventions: rPNMS (blue line) and sham (red line). The open triangles and circles represent the individual data in the rPNMS and sham group respectively. There was no significant difference in hand dexterity change between the two groups. Post hoc pairwise comparison with Bonferroni correction revealed that the improvement in Purdue pegboard score was significant at 24 h afterward compared with baseline (*p = 0.003) and immediately after rPNMS (*p = 0.012).
