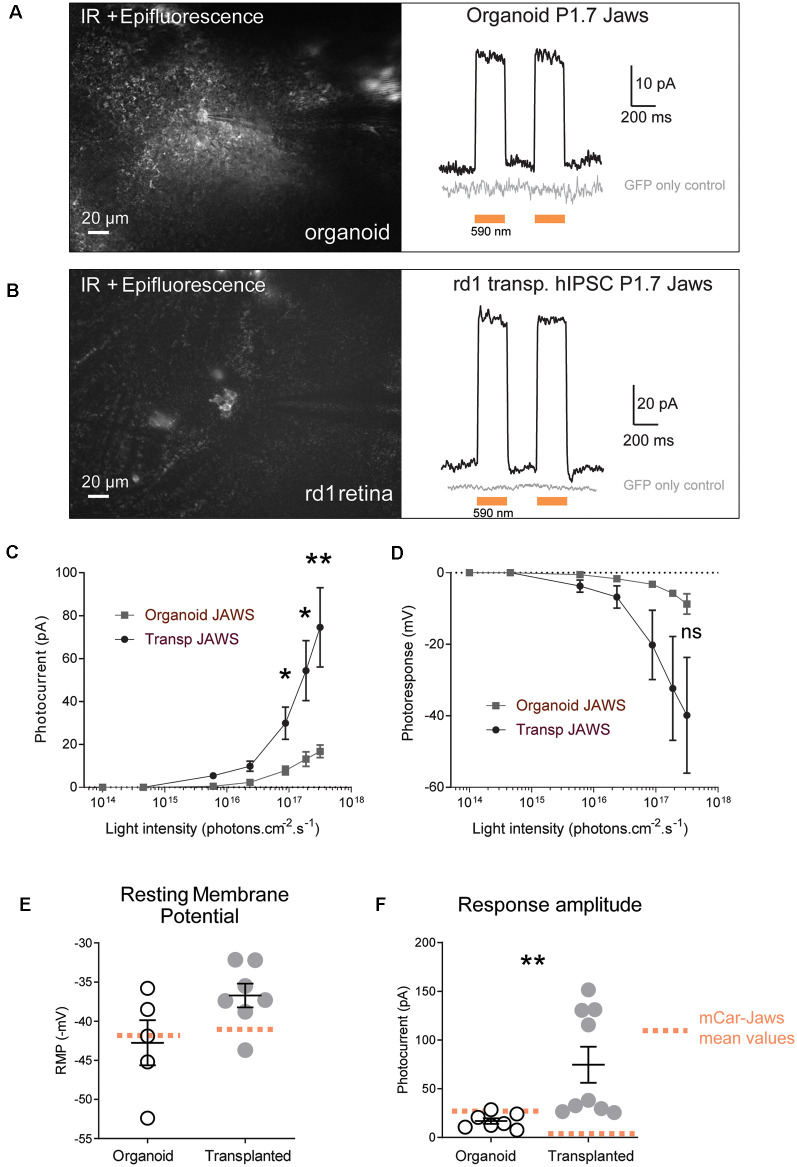
Figure 3.
Jaws-driven light responses in engineered retinal organoids before and after transplantation. (A) Left. Infrared (IR)/epifluorescence image showing a transfected organoid with an electrode contacting a GFP+ cell. Right, photocurrent responses after stimulation with two consecutive flashes at a light intensity of 3.1 × 10¹⁷ photons cm−2 s−1, absence of response in GFP- cells is shown in gray. (B) Left. Infrared/epifluorescence-Infrared image of a rd1 transplanted retina depicting small clusters of fluorescent cells. Right, photocurrent responses after stimulation with two consecutive flashes at a light intensity of 3.1 × 10¹⁷ photons cm−2 s−1, absence of response in GFP-cells is shown in gray. (C,D) Light-intensity dependency of photoresponse amplitude. Photocurrent (C) and voltage hyperpolarization (D) of GFP+ cells in organoids and rd1 transplanted retinae as a function of light intensities ranging between 1014 and 3.1×10¹⁷ photons cm−2 s−1. (E) Resting membrane potential (RMP) of Jaws-expressing photoreceptors in the dark (at 0 current) for the recordings presented in panel (D). Mean RMP values were −42, 76 ± 2, 88 mV in organoids and −36.72 ± 1.52 mV in transplanted cells. (F) Comparison of maximum photocurrent response amplitudes at the highest light stimulation intensity, for GFP+ cells in organoids (16.8 ± 2.92 pA) or after transplantation (74.57 ± 18.48 pA). Mean values obtained with our previous protocol (Garita-Hernandez et al., 2019) are depicted as doted orange lines. For all recordings the stimulation was performed at 590 nm if not stated otherwise. Values correspond to mean ± SEM. *p < 0.05, **p < 0.001, ns = not significant.

