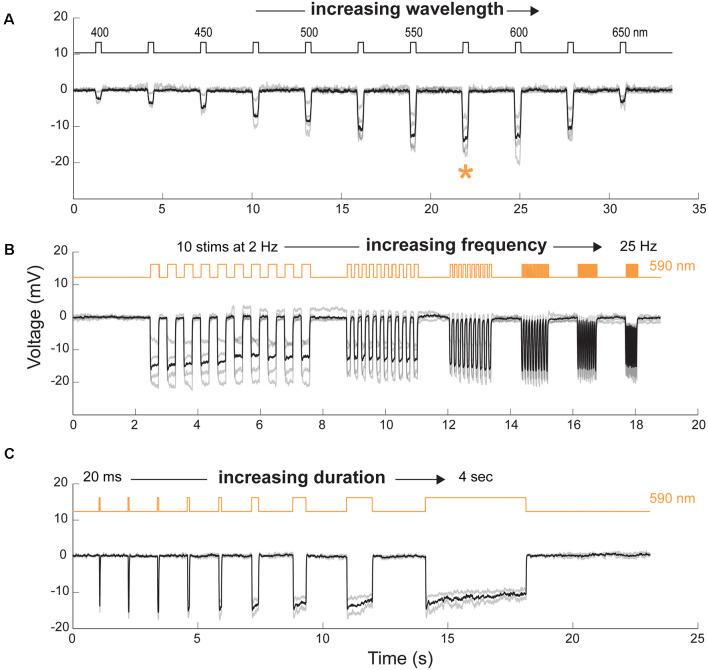
Figure 4.
Spectral and temporal properties of transplanted cells. (A) Cone hyperpolarization induced by Jaws as a function of increasing wavelengths stimuli ranging from 400 to 650 nm. Maximal responses, when recorded at an intensity of 8 × 10¹⁶ photons cm−2 s−1, were obtained at a wavelength of 575 nm (orange asterisk). (B) Modulation of Jaws-induced voltage responses at increasing stimulation frequencies ranging from 2 to 25 Hz. (C) Modulation of Jaws-induced responses as a function of stimulus duration with stimuli ranging from 20 ms to 4 s in Jaws expressing cones at 8 × 10¹⁶ photons cm2 s−1. The timing and duration of stimulations are depicted with black lines in (A) or orange lines in (B and C) (590 nm stimuli). n = 4, 4 and 2 cells in (A, B and C), respectively. Individual cell responses are represented in gray, mean response in black.

