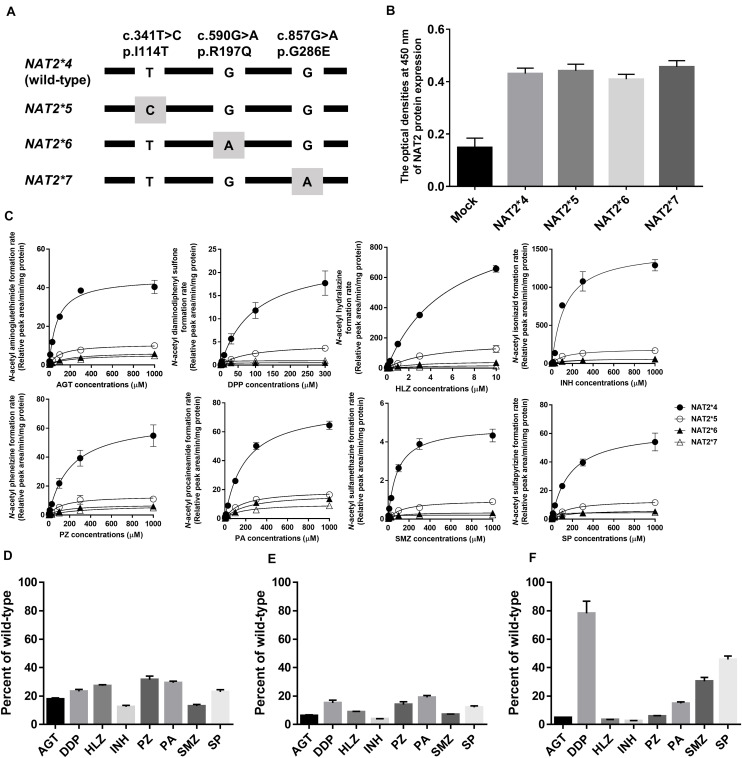
FIGURE 1.
N-Acetylation of eight drugs by NAT2 alleles. (A) Schematic of NAT2 alleles. The gray box represents signature SNVs. The nucleotide and amino acid positions are based on NM_000015.2 RefSeq. (B) NAT2 protein expression levels in lysates from HEK293 cells expressing NAT2∗4, ∗5, ∗6, and ∗7 alleles, as determined by ELISA. The Y axis represents the optical density at 450 nm. Each value represents the mean + SEM of four independent experiments. (C) Michaelis-Menten curves of the enzymatic activities of NAT2 proteins encoded by NAT2∗4, ∗5, ∗6, and ∗7 alleles toward eight drugs (aminoglutethimide, AGT; diaminodiphenyl sulfone, DDP; hydralazine, HLZ; isoniazid, INH; phenelzine, PZ; procaineamide, PA; sulfamethazine, SMZ; and sulfapyrizine, SP). Each point represents the mean ± standard deviation of four determinations. Open rhombus, closed rhombus, open triangle, and closed triangle present NAT2∗4, ∗5, ∗6, and ∗7, respectively. (D–F) Relative CLint values of NAT2∗5 (D), ∗6 (E), and ∗7 (F) among eight drugs using the CLint value of NAT2∗4 as a base of 100. Each value represents the mean + SEM of four independent experiments.

