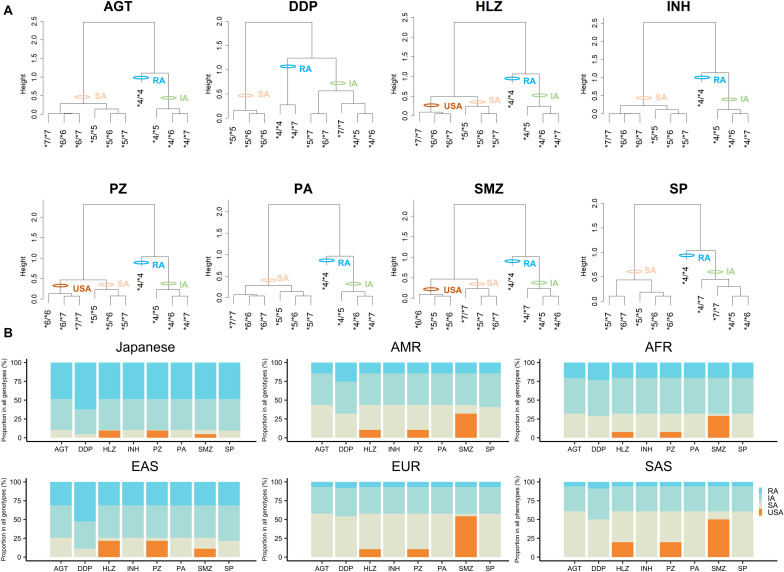
FIGURE 2.
Categorization of NAT2 genotypes into phenotypes by hierarchical cluster analysis based on activity scores and worldwide distribution of NAT2 phenotypes for different substrate drugs. (A) Cluster dendrograms using activity scores of NAT2 genotypes for eight drugs and categorization of NAT2 genotypes into the different phenotypes. (B) Proportion of predicted NAT2 phenotypes for each drug in Japanese, AFR, AMR, EAS, EUR, and SAS populations.

