Figure 1.
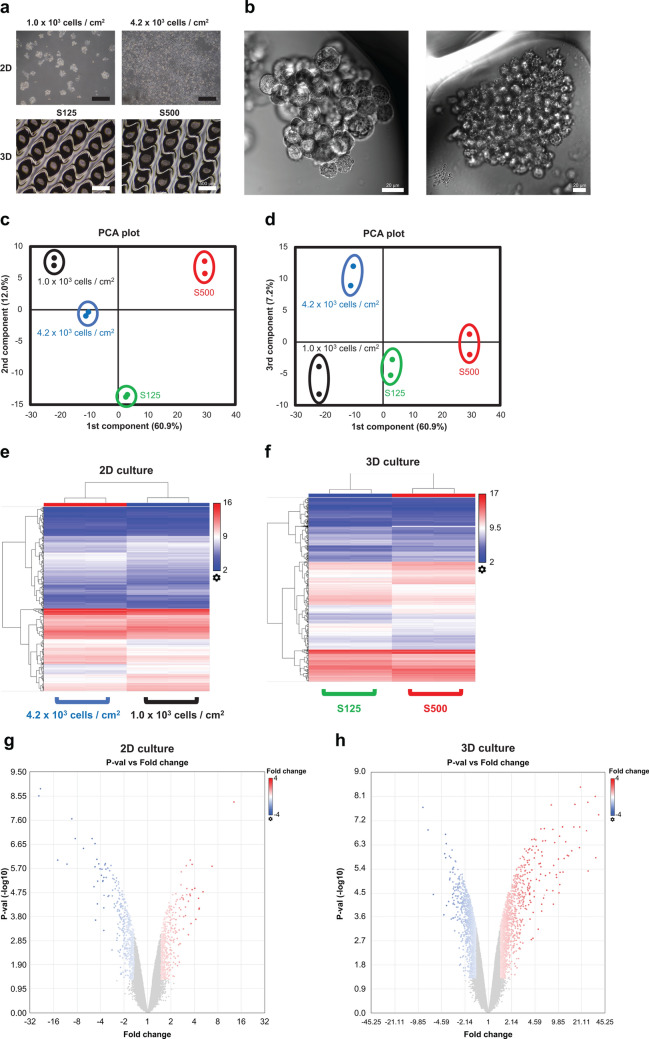
Microarray profiles of mRNA expression. All data were calculated using Transcriptome Analysis Console ver. 4.0.1.36. (a) Phase contrast images of 2D cultured cells and 3D cultured spheroids. The scale bar is 500 μm. (b) Differential interference contrast images of 3D cultured spheroids. The scale bar is 20 μm. (c) A 2D principal component analysis (PCA) plot of the first and second components. (d) A 2-D PCA plot of the first and third components. (e,f) 2D and 3D cluster analysis of differentially expressed genes. Red indicates increased expression, and blue denotes decreased expression. (g,h) The volcano plot of differentially expressed genes in 2D and 3D culture. Red indicates increased expression, and blue denotes decreased expression.

