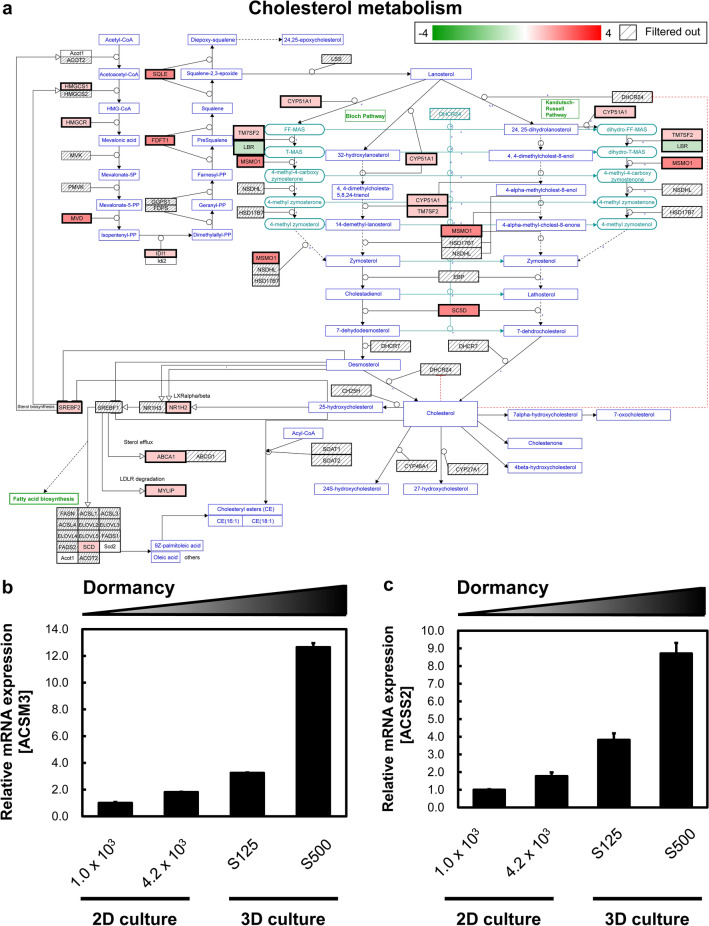
Figure 2.
Lipid metabolisms change in dormant cancer cells. (a) Cholesterol metabolism involved in 3D cultured S500 and S125 spheroids. S500 spheroids displayed higher cholesterol metabolism than S125 spheroids. Genes were selected from the “Cholesterol metabolism (includes both Bloch and Kandutsch–Russell pathways) (Homo sapiens)” pathway according to Wikipathways. Red indicates increased expression, and green denotes decreased expression. (b) The mRNA expression of acyl-CoA synthetase medium chain family member 3. (c) The mRNA expression of acyl-CoA synthetase short-chain family member 2. All mRNA expression analyses were conducted using Transcriptome Analysis Console ver. 4.0.1.36. Genes with changes in expression exceeding 1.5-fold and significant at p < 0.05 genes were extracted. n = 2.

