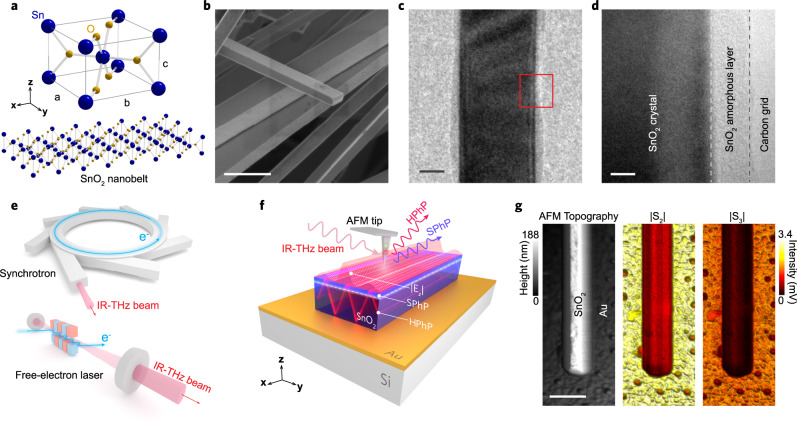
Fig. 1. Overview of SnO2-NBs morphology and spectral nano-imaging experiments.
a Schematic of SnO2 unit cell for tetragonal Rutile, and crystalline structure of the nanobelt. Blue and yellow spheres represent tin (Sn) and oxygen (O) atoms, respectively. b SEM image of SnO2-NBs. c TEM image of an isolated nanobelt covered by a thin amorphous layer in a carbon grid. d High-magnification TEM image (red square in c) highlighting the crystalline structure covered by a thin amorphous layer. e Accelerator-based IR-THz sources employed in the spectral nano-imaging experiments. f Experimental schematic showing the IR-THz beam illuminating a metallic AFM tip (nano-antenna) for the s-SNOM experiment. The highly confined and vertically polarized electric fields (Ez) at the tip apex launch surface (SPhPs) and volume (HPhPs) polaritons waves in the SnO2-NB. g Morphology (AFM topography) and broadband reflectivity (|S2| and |S3|) nanoscale images of an isolated SnO2-NB/Au simultaneously measured by SINS. Scale bars in b, c, d, and g represent 1 µm, 50 nm, 5 nm, and 500 nm, respectively.

