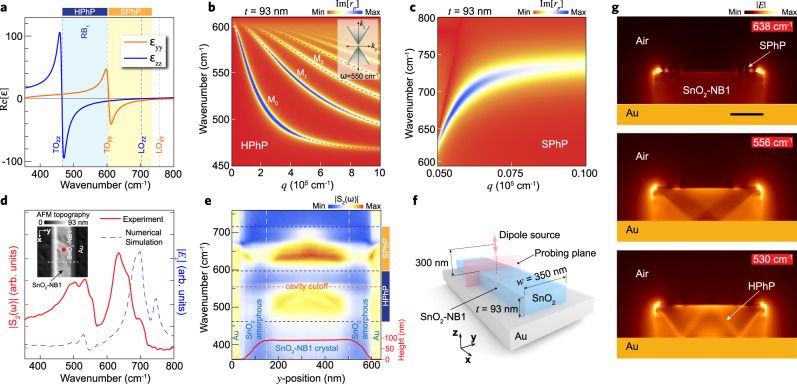
Fig. 2. Polaritonic activity in SnO2-NBs.
a Real part components of the electrical permittivity (εyy and εzz) of SnO2 showing the hyperbolic (HPhP) spectral region (light blue-shaded Reststrahlen band type I, RB1) and surface phonon polaritons (SPhP) window (light yellow-shaded). b, c Dispersion relation for volume (HPhPs) and surface (SPhPs) phonon polaritons in SnO2, respectively. False-color plot represents the calculated imaginary part of the complex reflectivity for an air/SnO2/Au multilayered structure. Dashed lines in b represent the extracted from Eq. 2. M0 and M1,2,... represent the fundamental and high order phonon mode dispersions, respectively. Inset b depicts the dispersion in isofrequency at 550 cm−1. d SINS amplitude S2(ω) point spectrum (red solid line) of the SnO2-NB1. Inset shows 1 × 1 µm2 AFM topography of the SnO2-NB1 (t = 93 nm, w = 350 nm), and the red dot indicates the SINS point spectrum location. FDTD-simulated spectrum (blue dashed line) obtained from |Ez| integration along the red-dashed vertical line in f. e SINS spectral linescan along the white-dashed line in the inset d. The red solid line profile at the bottom represents the AFM height of the SnO2-NB1. Vertical white-dashed lines delimit amorphous and crystalline SnO2 phases. Horizontal blue dark-dashed lines denote the HPhPs and SPhPs spectral ranges. The horizontal orange dashed line indicates the cutoff frequency for this NB. f Parameters-space for the FDTD numerical simulations of the SnO2-NB1 sample. g Simulated electric field |E| distribution inside the NB revealed by cross-sections at the frequencies 638 (outside RB1), 556, and 530 cm−1, respectively. The |E| intensity cross-sections highlight the presence of SPhPs (outside RB1) and volume standing waves (HPhPs inside RB1).

