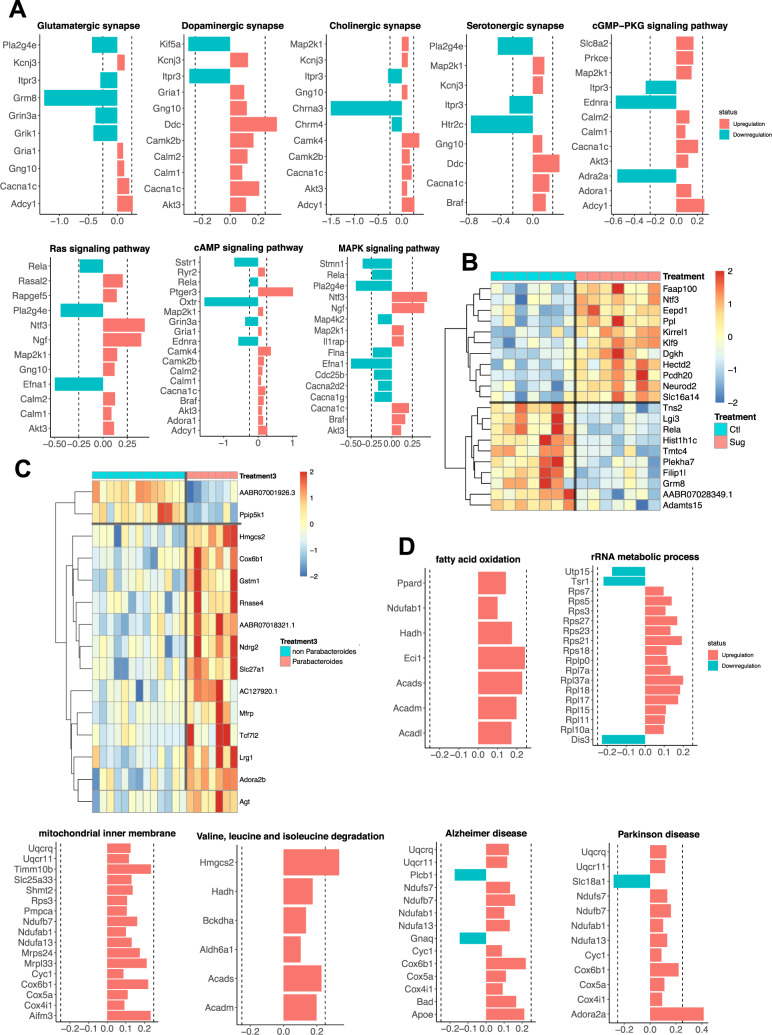
Fig. 5. Effect of early life sugar or targeted Parabacteroides enrichment on hippocampal gene expression.
A Pathway analyses for differentially expressed genes (DEGs) at a P value < 0.01 in hippocampal tissue punches from rats fed early life sugar compared with controls. Upregulation by sugar is shown in red and downregulation by sugar in blue. B A heatmap depicting DEGs that survived the Benjamini–Hochberg corrected FDR of P < 0.05 in rats fed early life sugar compared with controls. Warmer colors (red) signify an increase in gene expression and cool colors (blue) a reduction in gene expression by treatment (CTL control, SUG early life sugar; n = 7/group). C A heatmap depicting DEGs that survived the Benjamini–Hochberg corrected FDR of P < 0.05 in rats with early life Parabacteroides enrichment compared with combined control groups. Warmer colors (red) signify an increase in gene expression and cool colors (blue) a reduction in gene expression by treatment (n = 7, 14). D Pathway analyses for differentially expressed genes (DEGs) at a P value < 0.01 in rats enriched with Parabacteroides compared with combined controls. Upregulation by Parabacteroides transfer is shown in red and downregulation in blue. The dotted line indicates ±0.25 log2 fold change.

