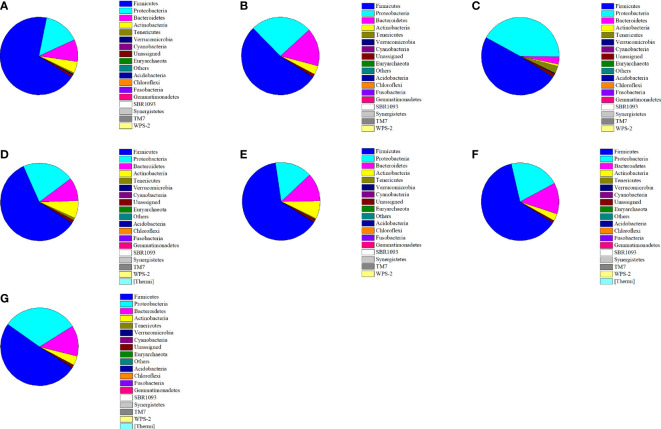
Figure 5.
Relative abundance of main phyla in the different mice groups after constipation induced by loperamide hydrochloride and the administration of different treatments (n = 10). (A) Normal control: no treatment; (B) negative control group: physiological saline; (C) positive control group: phenolphthalein (70 mg/kg body weight); (D) treatment group: P. acidilactici CCFM28 strain; (E) treatment group: P. acidilactici CCFM18 strain; (F) treatment group: P. acidilactici NT17-3 strain; (G) treatment group: P. acidilactici 102H8 strain.

