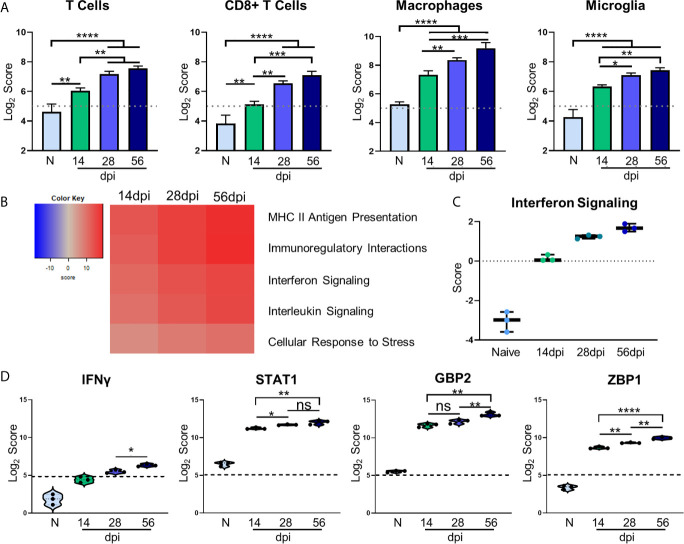
Figure 3.
Kinetics of chronic infection demonstrates classical immune cell activation and increases in IFNγ signaling-related genes. Cell-type profiling, global significance analysis, pathway scoring, and individual gene results of merged Neuropathology, Neuroinflammation, and InflammationPLUSCustomCodeset panels. (A) log2 score plots of infiltrating immune cell types T cells, CD8+ T cells, macrophages, and resident microglia compared to naïve time point control (*p-value < 0.05, **p-value < 0.01, ***p-value < 0.001, ****p-value < 0.0001). All cell types checked for expression above background level of 5 (shown by dashed line). (B) Heatmap of directed global significance scores compared to naïve controls based on direction of gene set pathway change. Red denotes gene sets whose genes exhibit extensive over-expression with the covariate, blue denotes gene sets with extensive under-expression. (C) Pathway analysis results of Interferon Signaling. Pathway checked for expression compared to background score of 0 (shown by dashed line). (D) log2 score plots of specific genes relating to IFNγ signaling, specifically IFNγ, STAT1, GBP2, and ZBP1 compared to naïve time point control (*p-value < 0.05, **p-value < 0.01, ***p-value < 0.001, ****p-value < 0.0001). All genes checked for expression above background level of 5 (shown by dashed line). ns, not significant.

