Figure 4.
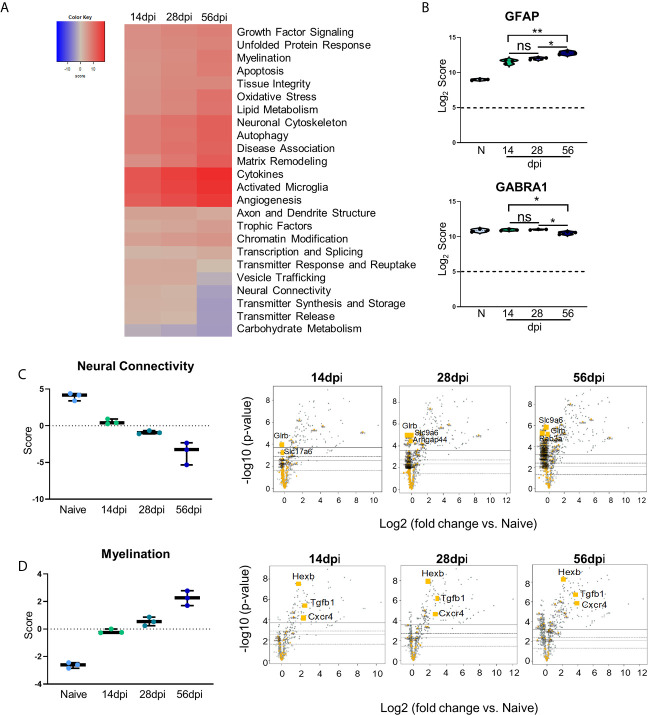
Kinetics of chronic infection reveals progressive neuropathological changes and previously unexplored attempts at repair/maintenance during chronic T. gondii infection. Global significance analysis, individual gene, and pathway scoring results of Neuropathology Panel. (A) Heatmap of directed global significance scores compared to naïve controls based on direction of gene set pathway change. Red denotes gene sets whose genes exhibit extensive over-expression with the covariate, blue denotes gene sets with extensive under-expression. (B) log2 score plots of specific genes relating to neuropathology, specifically GFAP and GABRA1 compared to naïve time point control (*p-value < 0.05, **p-value < 0.01). All genes checked for expression above background level of 5 (shown by dashed line). (C, D) Pathway analysis and volcano plot results of neural connectivity (C) and myelination (D) pathways significantly affected during T. gondii infection based on analysis. Volcano plot of directed global significance scores for neural connectivity and myelination gene sets. Genes within the selected gene set are highlighted in orange. Top three genes driving directional change identified based on fold change (x-axis) vs. p-value (y-axis). Four adjusted p-value cutoffs in each plot are as follows from bottom (dashed line) to top (solid line): <0.50, <0.10, <0.05, <0.01. ns, not significant.

