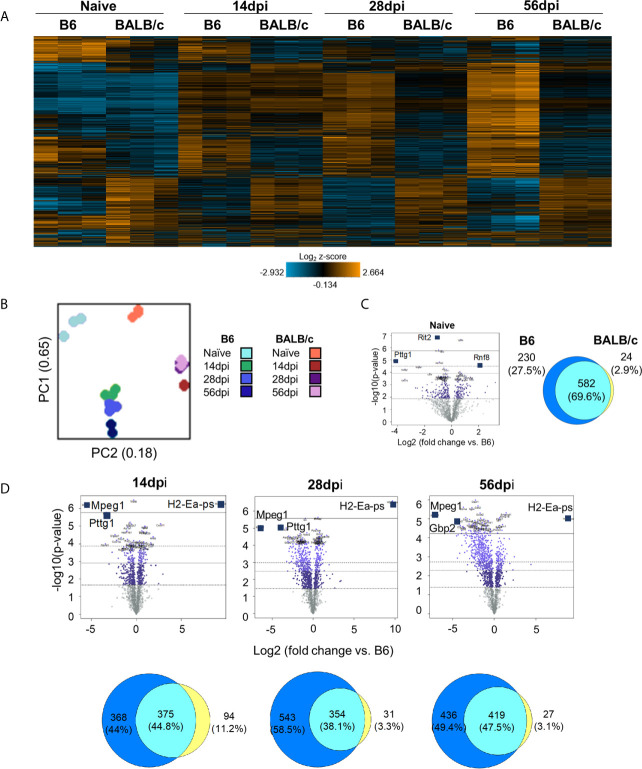
Figure 6.
BALB/c mice exhibit differences in timing and expression of genes compared to B6 mice during chronic infection. (A) Heat map of all genes from B6vsBALB/c merged Neuropathology, Neuroinflammation, and InflammationPLUSCustomCodeset panels. Gene expression depicted from low expression (blue) to high expression (orange). Heat map generated from normalized gene expression data using Basic nSolver software. (B) PCA plot of B6 and BALB/c biological replicates at all time points. Numbers on axes represent percentage of variation in that component. (C, D) BALB/c differential expression analysis results and overlap between differentially expressed genes of Naïve (C) and infection timepoints (D) (14dpi, 28dpi, and 56dpi) compared to B6 control values. Top 3 genes identified based on fold change (x-axis) vs. p-value (y-axis). 4 adjusted p-value cutoffs in each plot are as follows from bottom (dashed line) to top (solid line): <0.50, <0.10, <0.05, <0.01. Numbers and percentages in Venn diagrams based on genes significantly upregulated with adjusted p-value cutoff <0.05.

