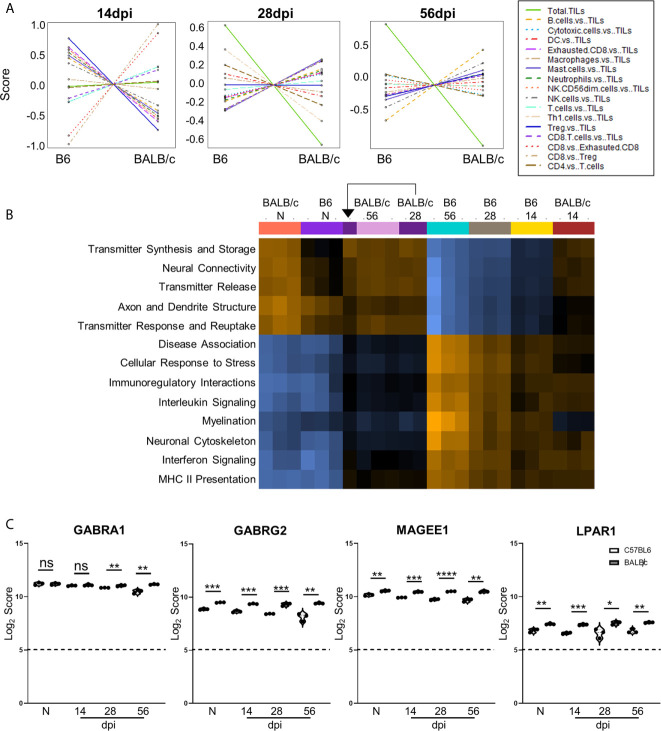
Figure 7.
Differences in cell recruitment, pathway activation, and specific regulatory genes demonstrate enhanced control of infection in BALB/c mice. (A) Cell type summary plots of recruited cells shown in BALB/c mice vs. B6 mice per time point. (B) Pathway score summary plot of BALB/c Vs. B6 mice depicted from downregulation (blue) to upregulation (orange). Summary plot generated by clustering pathways based on similar scores. Samples are arranged in plot according to similarity of pathway score profiles. (C) log2 score plots of specific genes relating to neuronal health and repair, specifically GABRA1, GABRG2, MAGEE1, and LPAR1 compared to naïve time point control (* = p-value < 0.05, ** = p-value < 0.01, *** = p-value < 0.001, **** = p-value < 0.0001). All genes checked for expression above background level of 5 (shown by dashed line). Gene selection significance determined via differential expression analysis statistics (p-value<0.05). All graphs shown as fold change over background Significance between mouse strains at each time point determined by Unpaired Two-Tailed Student’s t-Test (* = p-value <0.05, ** = p-value <0.01, *** = p-value < 0.001, **** = p-value < 0.0001). ns, not significant..

