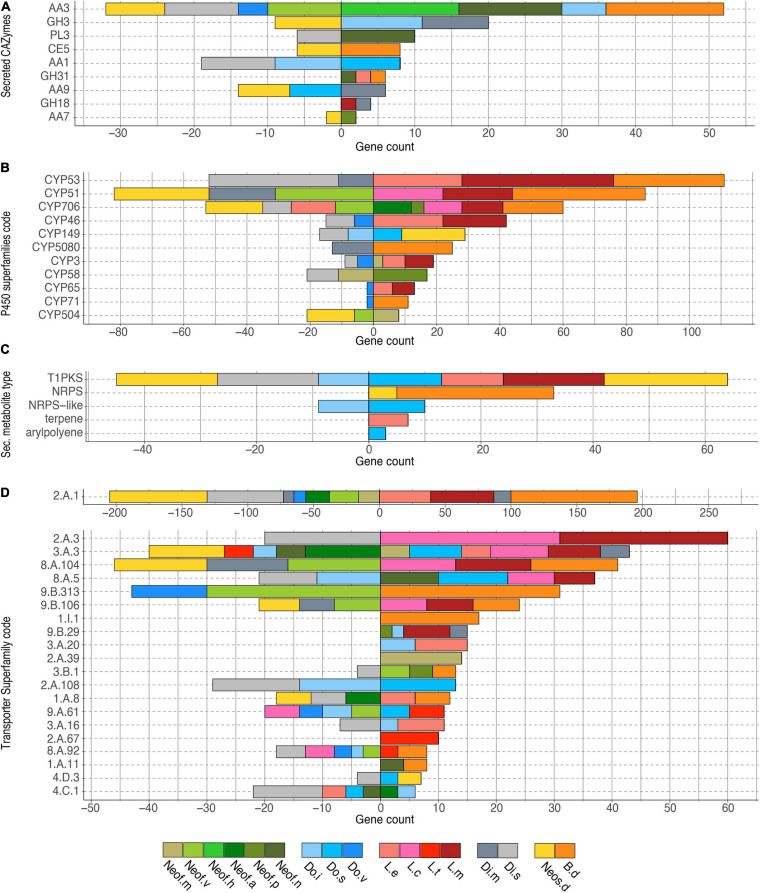
FIGURE 4.
Bar plot of the counts of genes annotated in each group of significantly expanded functional category. (A) Secreted CAZymes, (B) P450 superfamilies, (C) Secondary metabolite type, and (D) Transporter superfamilies. Only genes significantly overrepresented (P < 0.01) in the gene families expanded in the Botryosphaeriaceae group are shown.

