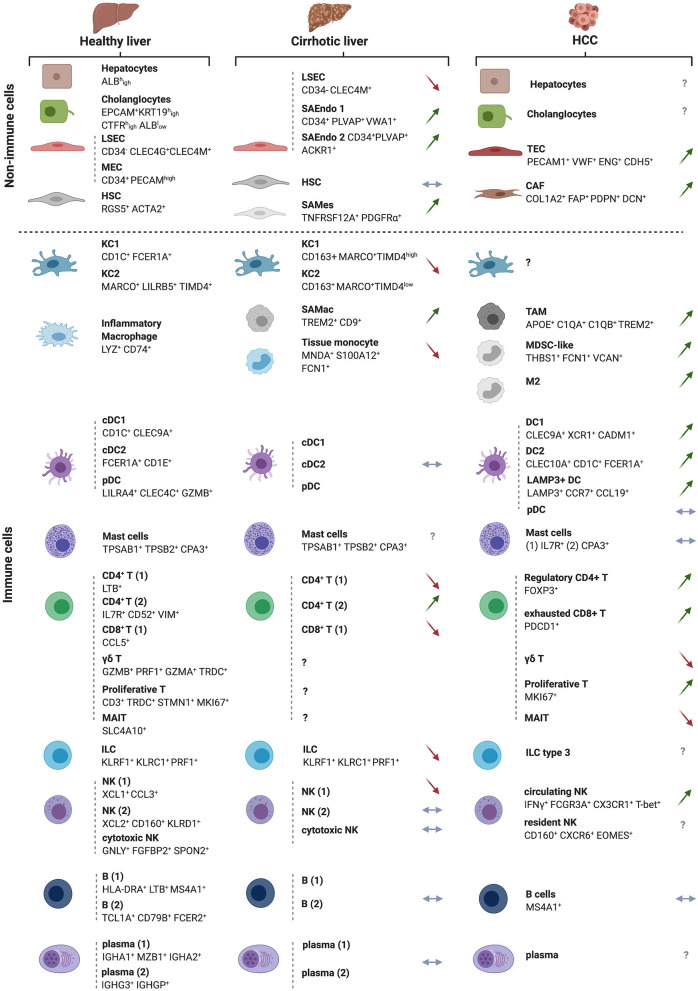
Figure 3.
The landscapes of the normal, cirrhotic and HCC-bearing livers. All immune and non-immune cell types identified by high-resolution single cell analyses of the human healthy and cirrhotic livers and of HCC are illustrated along with their discriminatory markers. Arrows depict direction of change in cirrhosis or HCC vs. the normal liver, with green arrows indicating an expansion, red arrows a depletion and blue horizontal arrow no change in the examined cell subset. The cellular landscapes of the healthy and cirrhotic livers were from (26). The information on the HCC landscape was from (27), but with complementary information from the following studies: γδ T cells and M2 macrophages (28), cancer-associated fibroblasts (CAFs) and tumor-endothelial cells (TECs) (29). New subsets of cells arising in the cirrhotic condition are also depicted and labeled as ‘scar-associated’ cells: SAEndo: scar-associated endothelial cells; SAMes: scar-associated mesenchymal cells; SAMac: scar-associated macrophages, as in (26). The HCC analyses were on sorted CD45+ immune cells. Symbols for genes and associated proteins are defined in Supplementary Table 1.

