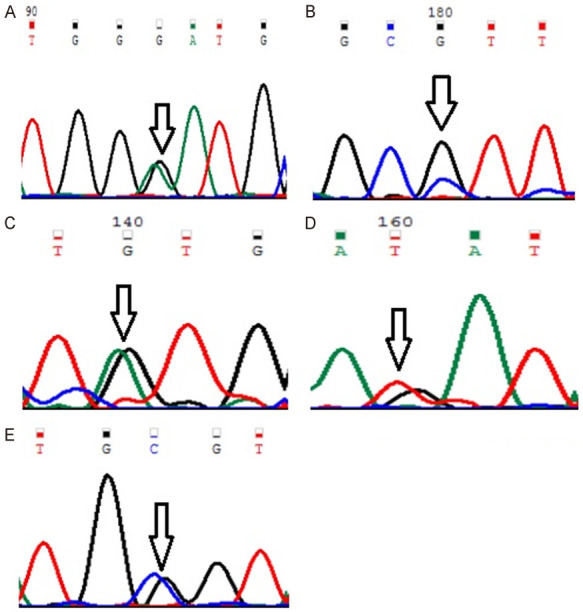
Figure 1.

Representative partial chromatograms of affected samples showing sequence variations in MYOM1 (indicated by arrows). (A) Gly333Gly (G>A; rs2230162) (B) Gly341Ala (G>C; rs8099021) (C) c.1022+23 (G>A; rs17177479) (D) c.3418+44 (G>T; rs55779127) and (E) c.3418+65 (C>G; rs8096379).
