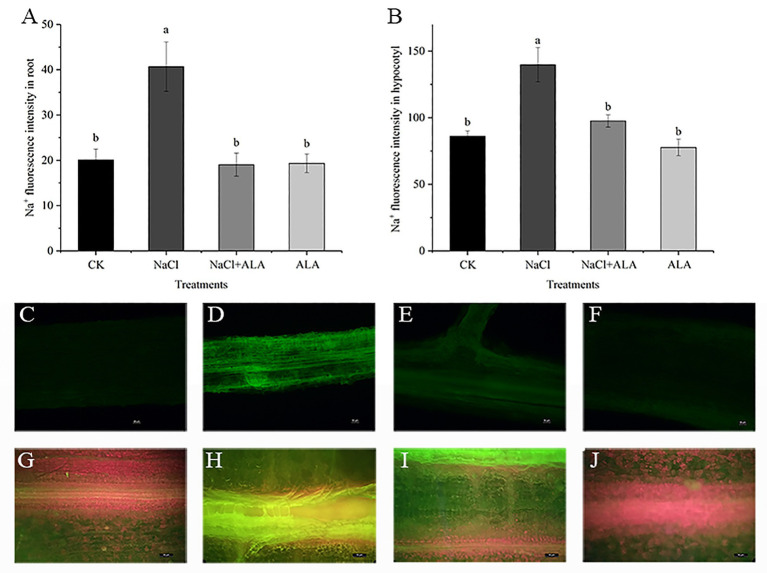
Figure 4.
The fluorescence images of Na+ in root and hypocotyl of cucumber seedlings. (A) Fluorescence intensities of Na+ in root. (B) Fluorescence intensities of Na+ in hypocotyl. Data represent means of four replicates. Bars indicate the SE. Significant differences (p < 0.05) between treatments are indicated by different letters. (C–F) The Na+ fluorescence images in root of seedlings. Scale bar = 50 μm. (G–J) The Na+ fluorescence images in hypocotyl of seedlings. Scale bar = 50 μm.

