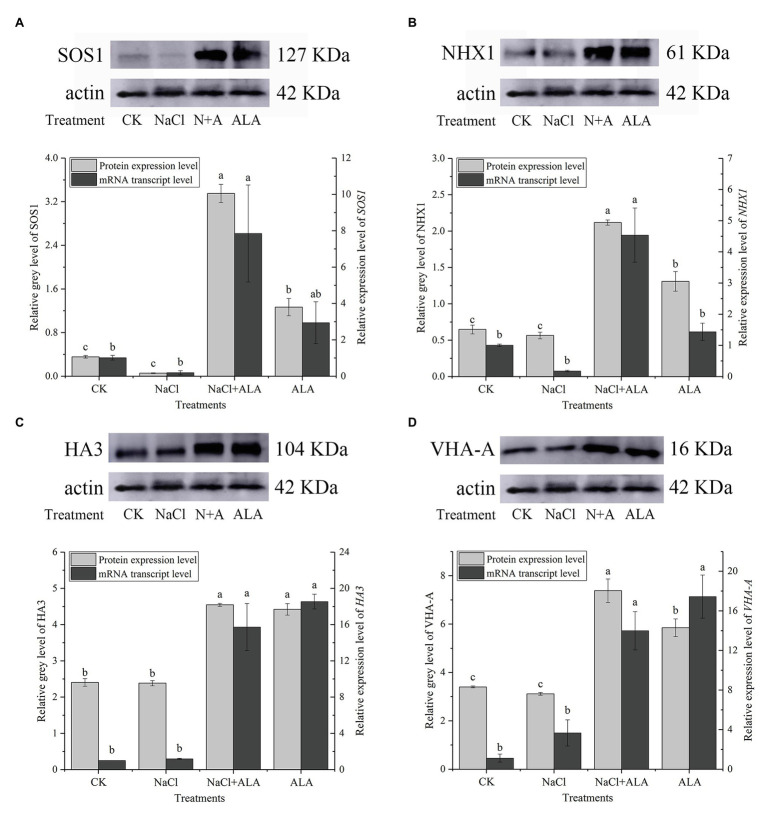
Figure 5.
The protein and gene expression levels of ion transporters in cucumber root. (A) Protein/gene expression of Na+/H+ antiporter in plasma membrane (SOS1). (B) Protein/gene expression of Na+/H+ antiporter in tonoplast (NHX1). (C) Protein/gene expression of H+-ATPase in plasma membrane (HA3). (D) Protein/gene expression of H+-ATPase in tonoplast (VHA-A). The bands are the protein expression bands of each transporter protein, and the histograms showing the ratio of gray level to actin gray level of ion transport protein expression. Data represent means of three replicates. Bars indicate the SE. Significant differences (p < 0.05) between treatments are indicated by different letters.

