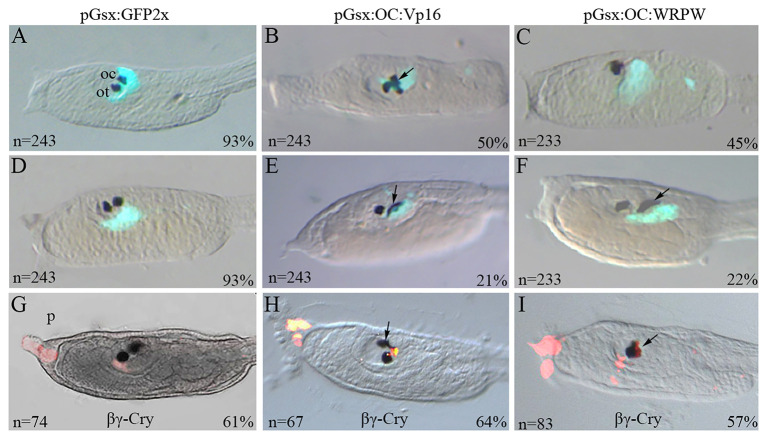
Figure 1.
Transgenic manipulation of Ciona Onecut during ocellus formation. Typical phenotypes of stage 26 larvae co-electroporated with (A,D) the pGsx>GFP2x control construct and (B,C) the active form pGsx>OC::Vp16 (pGsx>OC::Act) or with (E,F) the repressive form pGsx>OC::WRPW (pGsx>OC::Rep). (A,D) Proportion of transgenic control larvae showing GFP expression and (B,C,E,F) percentages of altered phenotypes observed in electroporated larvae are indicated; n, number of embryos analyzed in each condition. The percentages refer to the altered phenotypes with respect to the total GFP-positive larvae. (G–I) Immunofluorescent assay with anti-βγ-crystalline antibody on larvae electroporated with the OC::Act (H) and OC::Rep (I) constructs. As control, the larvae electroporated with the pGsx>GFP2x construct (G). n, number of embryos analyzed in each condition. Percentages indicate the number of embryos with the corresponding phenotype in each condition as described in Supplementary Table 5. n, number of embryos analyzed in each condition. In aquamarine green, the Gsx>GFP signal was used as internal control (A–F). In red is the expression of βγ-crystalline (G–I). The images were obtained with confocal microscopy. For all embryos, the anterior is on the left, lateral view.

