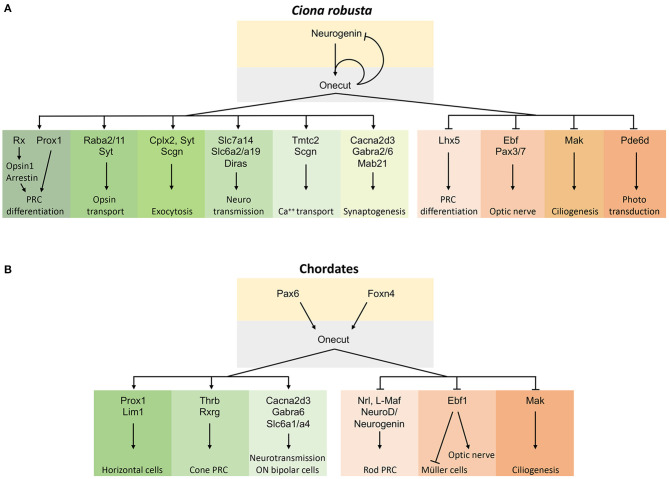
Figure 6.
Schematic representations of the gene regulatory pathway controlled by Oc factors in the chordate retina. (A) Oc gene network in Ciona PRC differentiation where only genes with a corresponding vertebrate ortholog/paralog are reported. (B) Oc gene network in chordate retina obtained by comparing the Ciona and vertebrate Oc target genes. Arrows within the gene network solely represent our current understanding of network relationships and do not imply genetic mechanisms such as direct or indirect transcriptional regulation. Oc-activated targets are on the left, repressed ones on the right.

