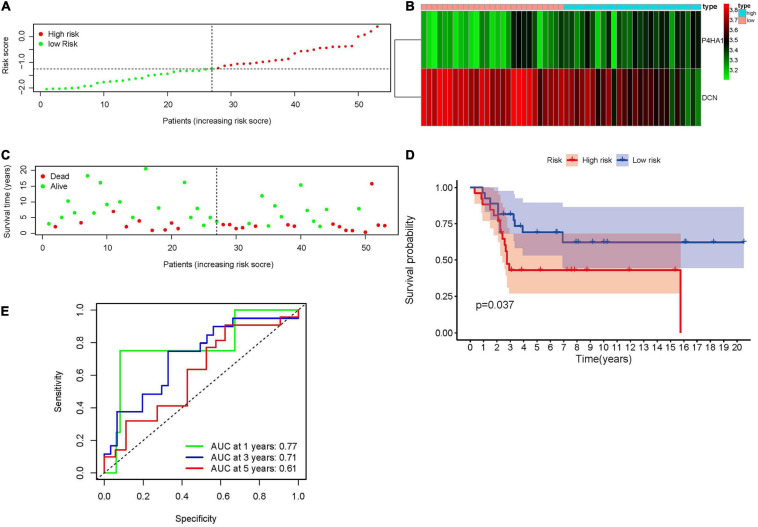
FIGURE 4.
Validation of the hypoxia-associated prognostic signature in GSE21257. (A) The distribution and median value of risk score. (B) The expression of P4HA1 and DCN in high- and low-risk groups revealed that P4HA1 was positively correlated with risk score while DCN showed the opposite trend. (C) The scatter plot of patients associated with risk scores. (D) Kaplan–Meier survival plot of patients in high- and low-risk groups. (E) Time-dependent ROC curve at 1, 3, and 5 years of hypoxia-associated prognostic signature. ROC, receiver operating characteristic; P4HA1, prolyl 4-hydroxylase subunit alpha 1; DCN, decorin.

