Figure 4.
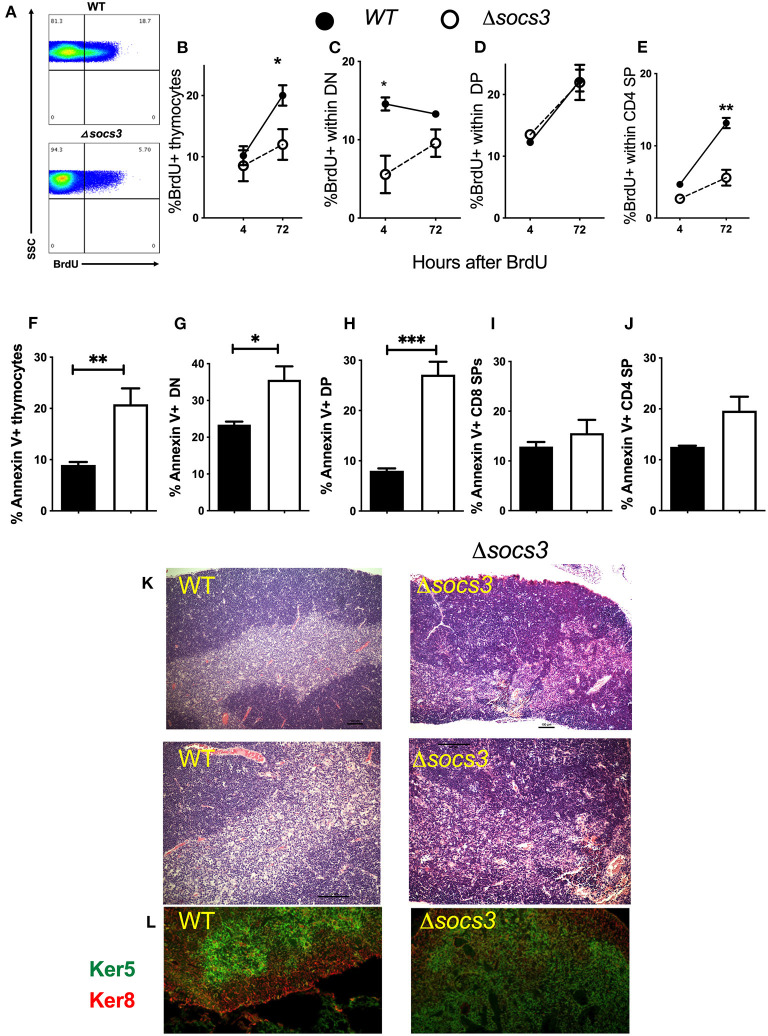
Decreased proliferation, differentiation and increased frequency of apoptosis in Δsocs3 thymocytes. (A) A representative histogram shows BrdU+ thymocytes from Δsocs3 and WT mice measured 72 h after BrdU administration. (B) The mean frequency of BrdU+ thymocytes ± SEM from WT and Δsocs3 mice (n = 5 animals per groups) 4 and 72 h after BrdU inoculation are depicted. The mean frequency ± SEM of BrdU+ cells within (C) DN, (D) DP, and (E) CD4 SP Δsocs3 and WT thymocytes at 4 and 72 h after BrdU administration is shown. The mean frequencies of Annexin V+ (F) total thymocytes and (G) DN, (H) DP, (I) CD4 SP, and (J) CD8 SP subpopulations ± SEM in Δsocs3 and WT mice (at least 5 per group) are shown. Differences between WT and Δsocs3 thymocytes are significant at *p ≤ 0.05, **p ≤ 0.01, ***p ≤ 0.001, two-way ANOVA and unpaired Student's t-test. (K) The haematoxylin and eosin staining depicting the organization of thymi from WT as compared to Δsocs3 mice. A representative micrograph from tissues from 5 mice per group analyzed is shown. Scale bar: 100 μm. (L) Double immunolabelling of keratin 5 and keratin 8 targeting the thymic cortex and medulla, respectively, in WT and Δsocs3 mice is shown.

