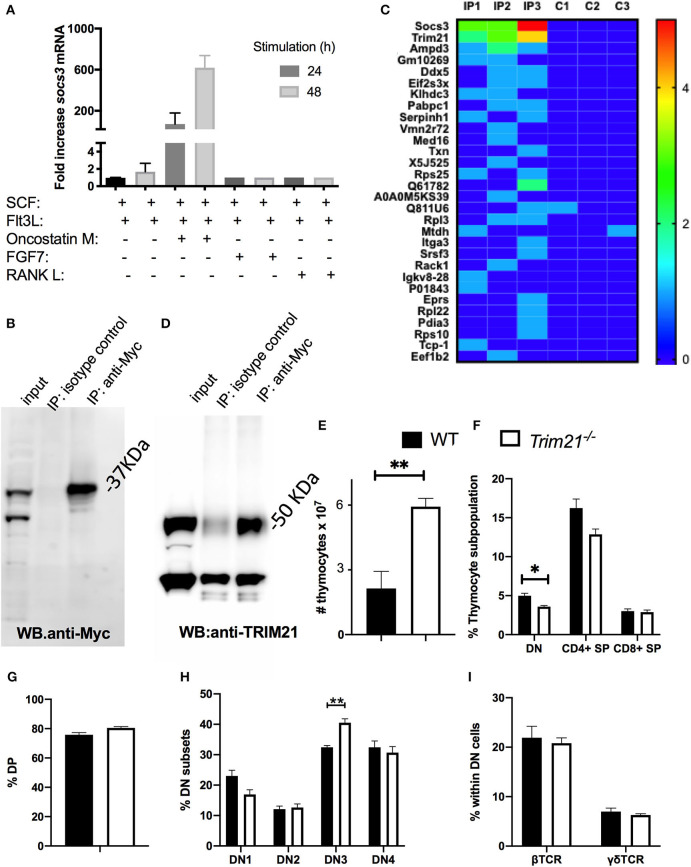
Figure 6.
SOCS3 in thymic epithelial cells binds to TRIM21. (A) OP9-DL1 cells were incubated with either SCF, Flt3L, OMS, FGF7, or RANK. Twenty four and forty eight hour after stimulation, the total mRNA was extracted and Socs3 and Hprt mRNA levels measured by real time RT-PCR. The mean relative fold induction of Socs3/ Hprt mRNA ratio in stimulated and unstimulated cells are depicted. (B) OP9-DL1 cells were transfected with an Myc-SOCS3 plasmid. The western blot of transfected cell lysates before and after immunoprecipitation with anti-myc or an isotype controls is shown. (C) Heat map of ranking proteins identified after tandem mass spectrometry in immunoprecipitates from socs3-transfected OP9-DL1 cells with anti-myc or isotype controls. Three replicates per condition were analyzed. Ranking was calculated with an algorithm weighing the number of replicates in which the protein was detected in the IP and in the control group, the number of peptide spectral matching the protein, the number of unique peptides and the intensity (the area under the curve). (D) Anti-SOCS3 or anti-isotype immunoprecipitates were analyzed by immunoblot using anti-TRIM21. (E) The mean number of WT and Trim21−/− thymocytes ± SEM are depicted (n ≥ 5 per group). Differences between groups are significative (**p ≤ 0.01 unpaired Student's t-test). (F,G) The mean frequency of thymic DN, DP, and SP subpopulations ± SEM in Trim21−/−and WT thymi (n = 5 per group). (H) The mean of frequency ± SEM of DN1-DN4 subpopulations (defined by CD44 and CD25 expression) in trim21−/−and WT thymi (n≥5 per group). (I) The mean % of β and γδ TCR+ cells within the DN thymocytes of WT and trim21−/− mice (n ≥ 5 per group). Differences between groups are significant at **p ≤ 0.01 unpaired Student's t-test.

