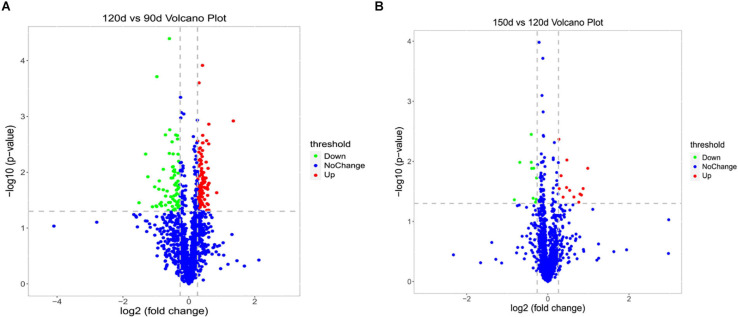
FIGURE 2.
Volcano plots of the univariate statistical analysis results. 120 d vs 90 d (A) and 150 d vs 120 d (B). The red dots indicate significantly upregulated proteins (P < 0.05 and FC > 1.2), and the green dots indicate significantly downregulated proteins (P < 0.05 and FC < 0.83). The blue dots represent proteins with non-significant (P > 0.05 or 0.83 < FC < 1.2) differences in expression.

