
Fig 2.
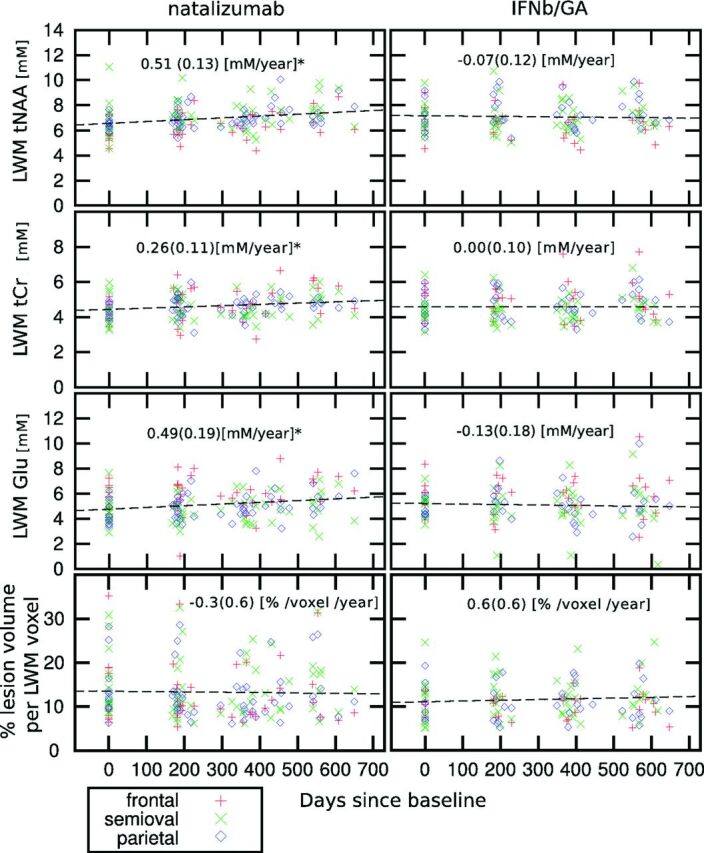
Scatterplot of individual measurements of tNAA, tCr, and Glu in LWM (mmol/L) (upper 3 rows) and percentage of lesion volume per LWM voxel (lower row) as a function of the days elapsed since the baseline for the patients treated with natalizumab and IFNb/GA. The asterisk indicates that patients treated with natalizumab show a significant increase of tNAA, tCr, and Glu in the LWM (mmol/L/year ± SD). At each time point (baseline, month 6, month 12, and month 18), the number of subjects in the natalizumab group was, respectively, 18, 25, 23, and 15; in the IFNb/GA group, it was 15, 17, 18, and 16; and in the healthy control group, it was 11, 12, 11, and 8.