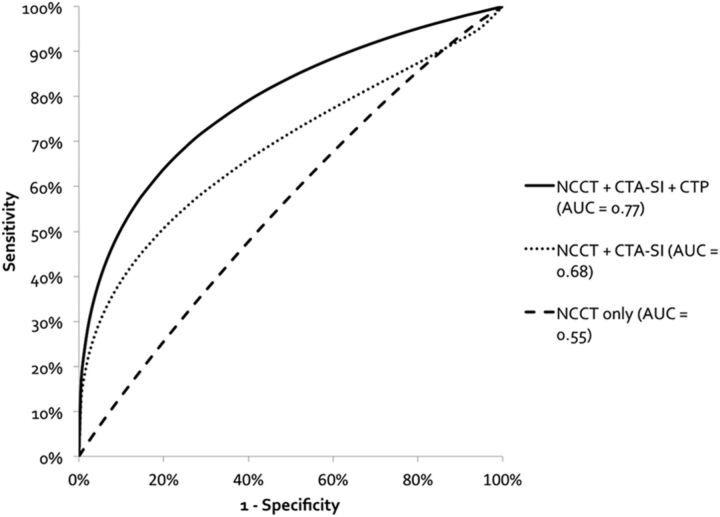
Fig 1.
Receiver operating characteristic curves show the diagnostic performance of the incremental CT protocol in the detection of lacunar infarction, without adjusting for multiple readers. There is a statistically significant increase in the area under the curve with each incremental protocol (CTP versus CTA, P < .006, and CTP versus NCCT, P < .001). The dashed line indicates NCCT only; the dotted line, NCCT and CTA-SI; and the solid line, NCCT, CTA-SI, and CTP.

