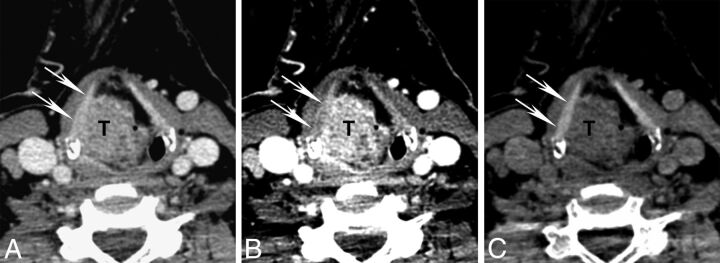
Fig 4.
Differences in attenuation of NOTC (arrows) and tumor (T) on different kiloelectron volt VMIs. Axial contrast-enhanced CT images are shown from a patient with a supraglottic squamous cell carcinoma with the same section reconstructed as a virtual monochromatic images at 70, 40, and 140 keV. A, Seventy-kiloelectron volt VMI shows tumor abutting the inner surface of the right NOTC. B, Forty-kiloelectron volt VMI shows greater attenuation of the tumor than on the 70-keV VMI due to iodine content, increased contrast between tumor and NOTC, and somewhat better depiction of tumor-NOTC interface. C, One hundred forty–kiloelectron volt VMI shows suppression of tumor attenuation but preserved high attenuation in the NOTC. Note the qualitative contrast improvement with clear distinction of tumor-NOTC interface.

