Figure.
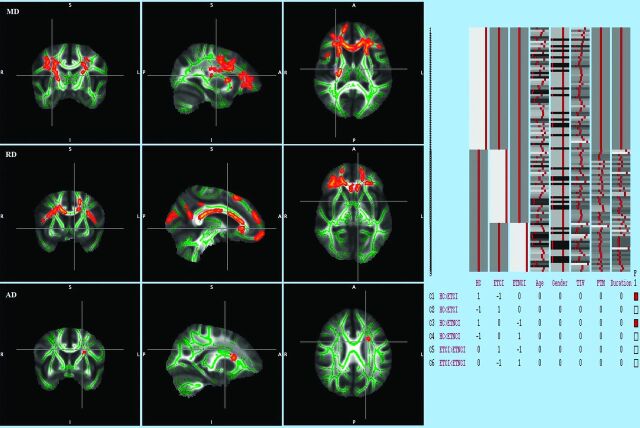
TBSS analysis (t test) performed in those with ETCI versus HC. Voxels demonstrating significantly (family-wise error–corrected P < .05) increased mean diffusivity, radial diffusivity, and axial diffusivity in ETCI compared with HC are shown in red-yellow. Voxels are thickened into local tracts and overlaid on the white matter skeleton (green). The design matrix used for the TBSS analysis is shown on the right.

