
Fig 1.
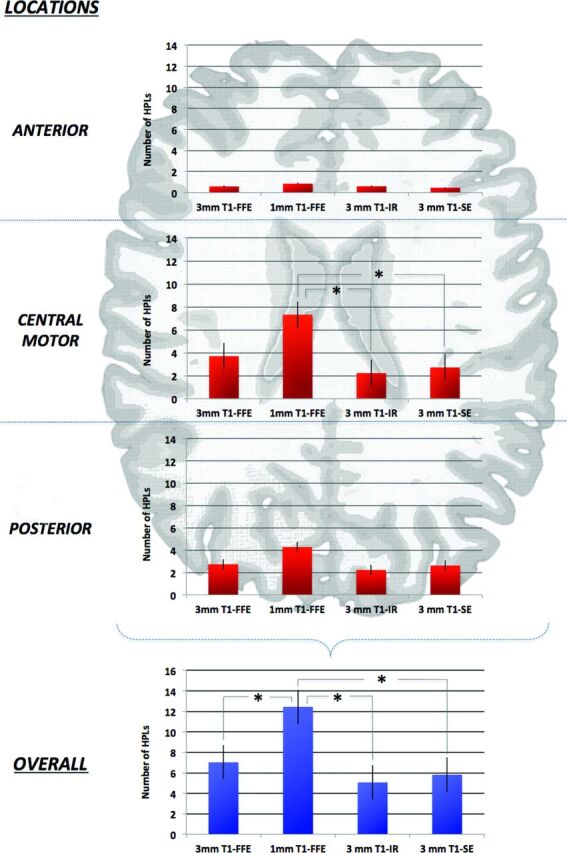
Schematic representation of a typical neonatal brain. Only the central (motor) location on the 1-mm reformatted T1 3D-FFE sequence scored a significantly greater number of HPLs compared with IR and SE sequences. The 1-mm axial reformatted T1 3D-FFE sequence identified a significant overall greater number of HPLs than other 3-mm sequences (P < .01).