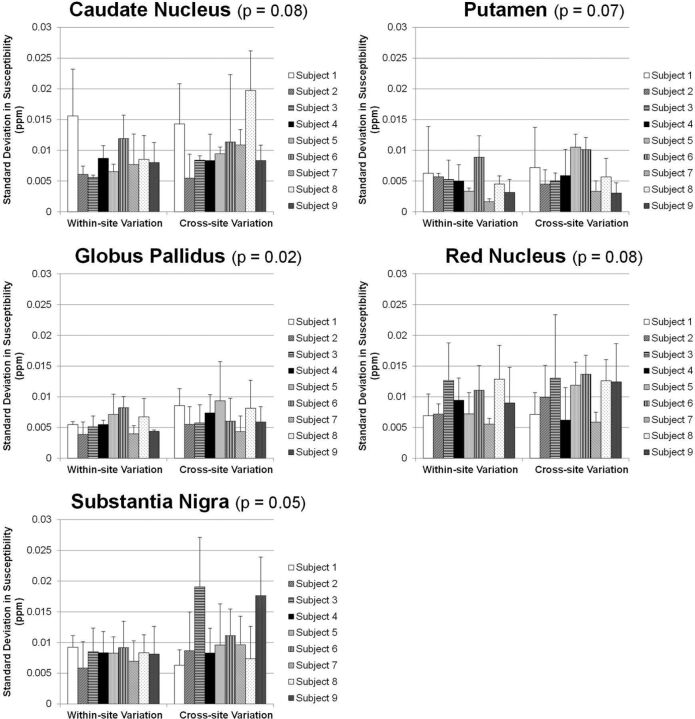
Fig 6.
Within-site (left) and cross-site (right) imprecisions shown as SDs from multiple measurements on the 9 subjects by using the deterministic QSM algorithm. The P values shown in the subplot titles stand for the difference between within-site and cross-site precisions (paired Student t test). For all 5 regions, cross-site variations are not larger than within-site variations. The putamen and globus pallidus show the highest precision, followed by the caudate nucleus, red nucleus, and substantia nigra.

